 BusinessIn the world of cybersecurity, Fortinet, Inc. stands out as a comprehensive provider of advanced, seamlessly integrated security solutions. Spanning a global footprint that covers the Americas, Europe, the Middle East, Africa, and the Asia Pacific, Fortinet's offerings are a testament to its broad and automated approach to safeguarding digital assets and networks. Business activities covers.
Total Addressable Market: $150B, Growing to $208B by 2027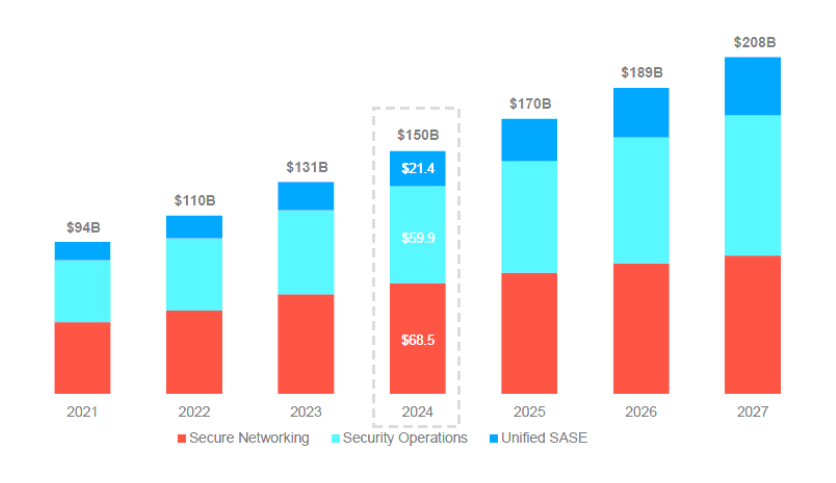 Diving deeper into Fortinet's portfolio, the company also offers the FortiSwitch series, designed to provide secure switching solutions that facilitate the connection of end devices in a protected manner. For organizations seeking robust wireless networking solutions, Fortinet's FortiAP series comes into play, while the FortiExtender offers a hardware appliance dedicated to extending the reach of secure networks. On the analytics and management side, Fortinet introduces the FortiAnalyzer and FortiManager product families, aimed at centralizing network logging, analysis, reporting, and scalable management of its FortiGate products, respectively. Not stopping there, Fortinet's FortiWeb series caters to the need for web application firewall solutions, and the FortiMail series offers secure email gateway solutions. For proactive detection and mitigation, Fortinet's FortiSandbox technology is a game-changer, complemented by FortiClient's endpoint protection capabilities that include 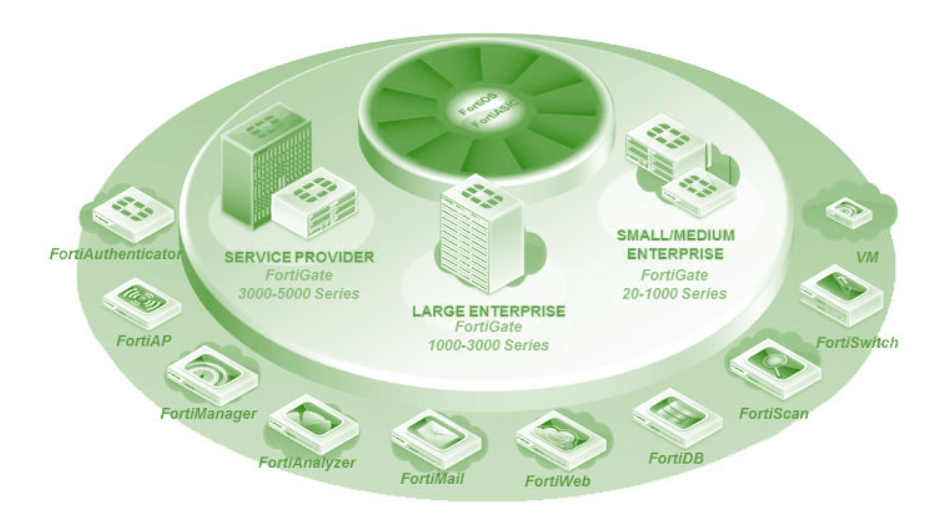 pattern-based anti-malware, behavior-based exploit protection, web filtering, and an application firewall. Ensuring secure access and authentication, Fortinet provides the FortiToken and FortiAuthenticator product families, alongside the FortiEDR/XDR for cutting-edge endpoint protection that combines comprehensive machine-learning anti-malware execution with real-time post-infection protection. Beyond product offerings, Fortinet prides itself on delivering top-notch
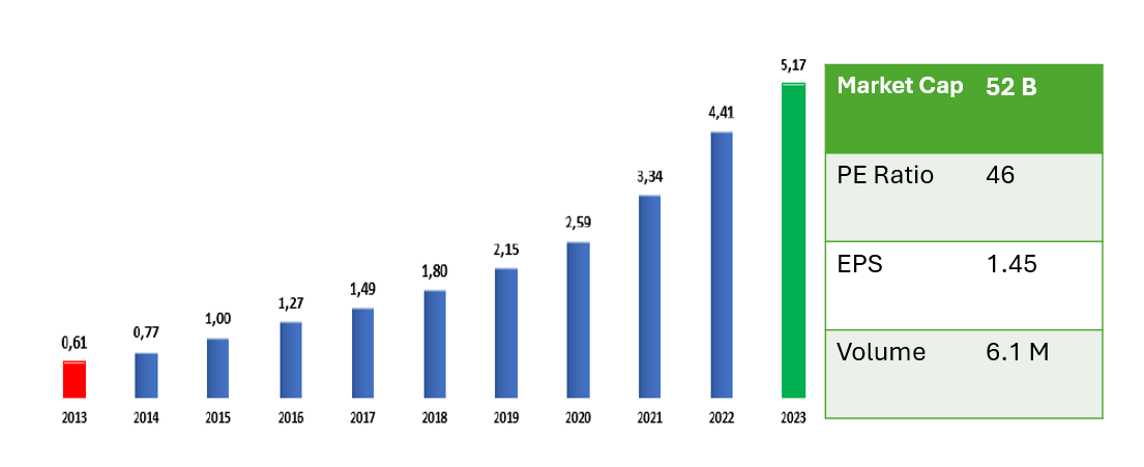
Key Data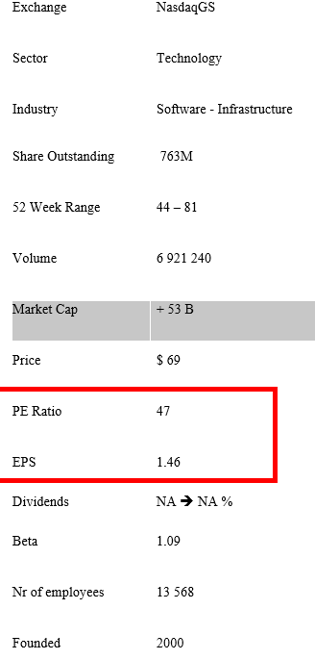 Fortinet’s 1250 trading days - stock price fluctuations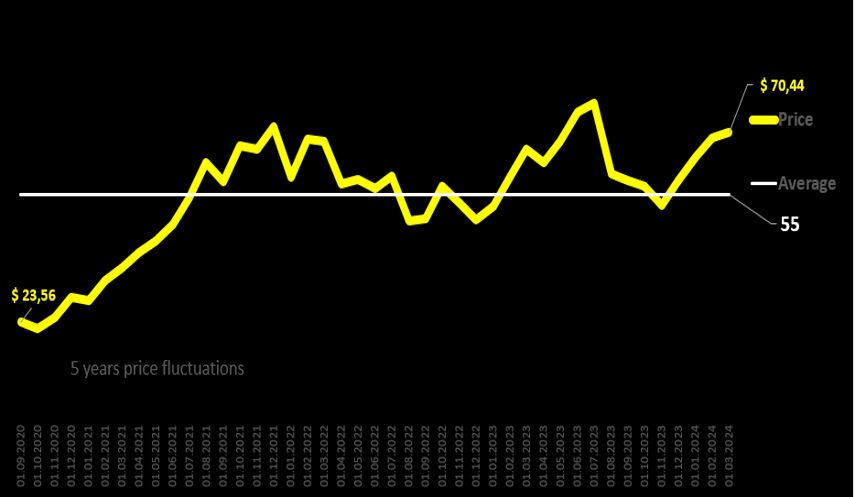 Historical daily share price chart and data for the Fortinet since 01-09-2020 adjusted for splits. The latest closing stock price for Fortinet as of March 01, 2024, is $70. The all-time high Fortinet stock closing price was $79 on 01 June 2023. Fortinet five years average stock price is $55, which is -21% lower than the current share price. Valuations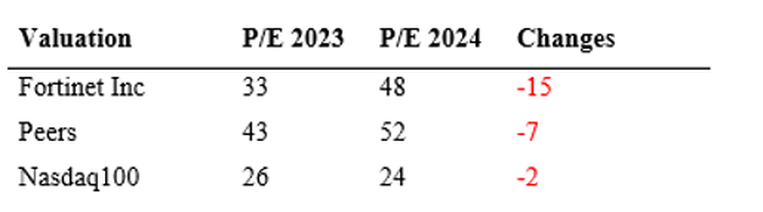 On a trailing basis, Fortinet currently trades at multiples of 9.9x EV/sales, 35x EV/EBITDA, and 48x P/E. The Price-to-Earnings (P/E) ratio) for Fortinet Inc. stands out good valued when compared to its peers, positioned at approximately 48.00, which is considerably lower the median of its comparison group. This places Fortinet Inc.'s market valuation slightly lower than that of its peer group. 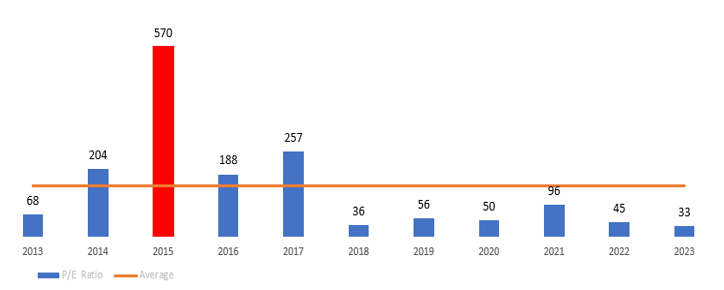 However, when comparing the current P/E ratio of Fortinet Inc. to its own 10-year historical average of 154.0, it's observed to be significantly lower. This suggests that Fortinet Inc.'s current market valuation is in alignment with its historical valuation trend over the last five years. Fortinet Inc., renowned for its contributions to cybersecurity and the integration of networking and security solutions globally, showcases impressive financial strength. With a Return on Equity (ROE) reaching 845% and a Return on Assets (ROA) at 17%, these figures underscore the company's adeptness in utilizing its equity and assets to drive. profitability. Such performance not only reflects the company's current financial health but also indicates a strong potential for sustained growth in the future. Fortinet stands out in the cybersecurity field, achieving a notable profit margin of 21.64% and an operating margin of 27.15% over the trailing twelve months. These margins highlight Fortinet's efficiency in managing its operations and converting sales into net income, illustrating the company's financial health and operational excellence. Such performance is indicative of Fortinet's strong position in the market and its ability to maintain profitability, underscoring its potential for continued success. Financial HealthA table displaying the year-over-year percentage changes for both Total Assets and Total Liabilities Net Minority Interest from 2020 to TTM. 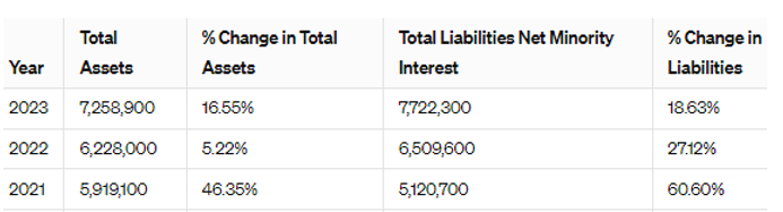 Fortinet’s Platform Approach to Cyber Security 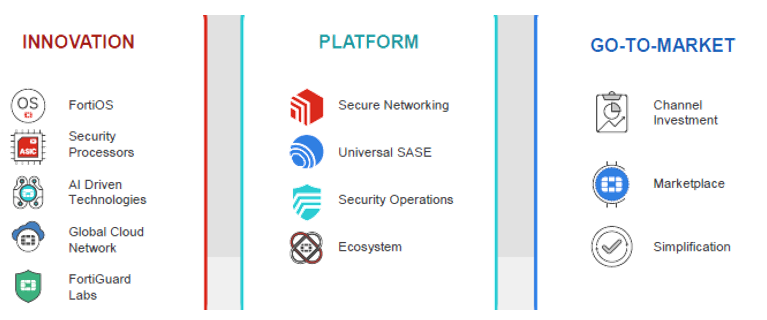 10 years - Fortinet Inc. Income Statements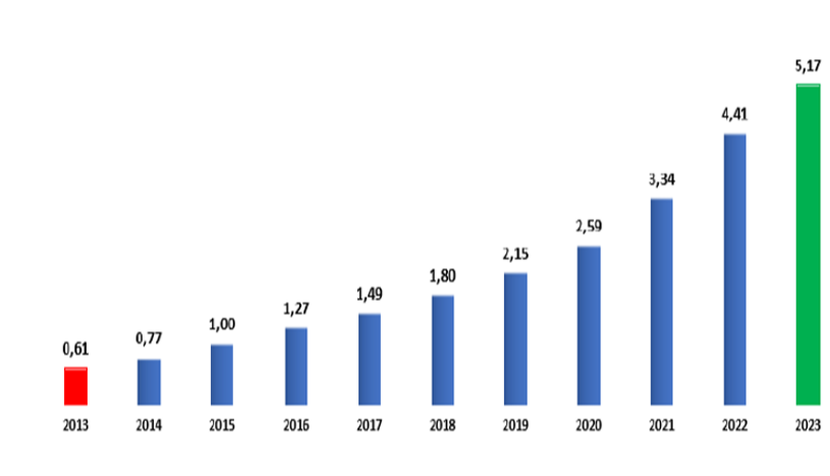 Fortinet Inc. has shown impressive revenue growth from 2013 to 2023, increasing from $0.61 billion to $5.30 billion. This growth highlights Fortinet's strong position and expanding market share in the cybersecurity sector. The company's annual revenue growth rate of 20.09% in 2023 indicates a consistent upward trajectory, emphasizing its success in responding to increasing cybersecurity demands. For detailed revenue history and growth analysis, visit Stock Analysis. Highly Diversified Business  CompetitorsFinancial Risk Industry Average time from detection to remediation 
This statistics highlight the significant challenges that organizations face in detecting, containing, investigating, and remediating cybersecurity incidents. These observation reflect a broader trend in cybersecurity operations and the critical importance of rapid response to mitigate the impact of cyberattack. Moreover, the recovery from a cyberattack can be a lengthy process, with an average of 277 days required to fix the damage from a cyber incident. Organizations that have experienced more than one data breach report that 57% have passed the incident costs onto their consumers, yet only 51% have increased security investments. This reflects a gap in response that could exacerbate vulnerabilities and costs associated with cyber incidents. The role of human error in cybersecurity breaches is significant, with 82% of breaches involving a human element. This emphasizes the need for comprehensive cybersecurity training and awareness programs to mitigate risks associated with phishing attacks, weak passwords, and sharing sensitive information over unsecured channels. Data breach response times and their impact on costs and reputation are critical considerations for organizations. The faster a data breach is identified and contained, the lower the costs associated with it. Companies with dedicated, trained teams and tested response plans respond faster and more effectively to cyber incidents. Security automation can decrease the average response time, while IoT devices have been found to increase the average cost of a data breach due to their vulnerabilities. New SEC Rule 4 Days to disclose material cybersecurity. The Securities and Exchange Commission (SEC) has introduced new rules aimed at enhancing and standardizing disclosures regarding cybersecurity risk management, strategy, governance, and incidents by public companies. These rules, adopted on July 26, 2023, are part of an effort to provide investors, companies, and the markets with more consistent, comparable, and decision-useful cybersecurity information. The main highlights of these new rules are as follows: By 2026, more than 60% of organizations will have more than one type of firewall deployment, which will prompt adoption of hybrid mesh firewalls.”  SWOT AnalysisThe company exhibits strong foundational elements. It surpasses over 70% of other companies in terms of a balanced blend of growth, profitability, debt management, and market presence. However, from a short-term investment standpoint, the company's fundamental outlook has worsened.
ManagementKen Xie, 60, is the Founder, CEO, and Director of Fortinet, Inc., a role he has held since October 2000, with a tenure of 23.4 years and a compensation of US$14.2 million. He has a rich background in networking and security industries, including founding NetScreen Technologies and serving as President of Fortinet. Xie's contributions to the tech industry have earned him numerous accolades, including being named a Technology Pioneer by the World Economic Forum. He holds advanced degrees in electrical engineering from Tsinghua University and Stanford University. Xie's early entrepreneurship began with SIS in 1993, leading to significant recognition in the tech and engineering fields, including awards from the World Economic Forum and Ernst & Young. He holds degrees from Tsinghua University and Stanford University. OwnershipThe ownership structure of Fortinet Inc:
0 Comments
BusinessPaycom is a leader in the human capital management/payroll software industry that continues to take market share from long-standing incumbents. Customers love Paycom for its integrated software offering with robust self-service capabilities and the excellent service the Paycom team delivers. The company has a highly repeatable sales process and a solid track record for selling more to existing customers while acquiring new users. Paycom is an emerging leader in a large addressable market where they believe they are only just beginning to scratch the surface. Paycom Software, Inc. provide a comprehensive, cloud-based human capital management (HCM) solution offered as a Software-as-a-Service. The solution offers.
Key Data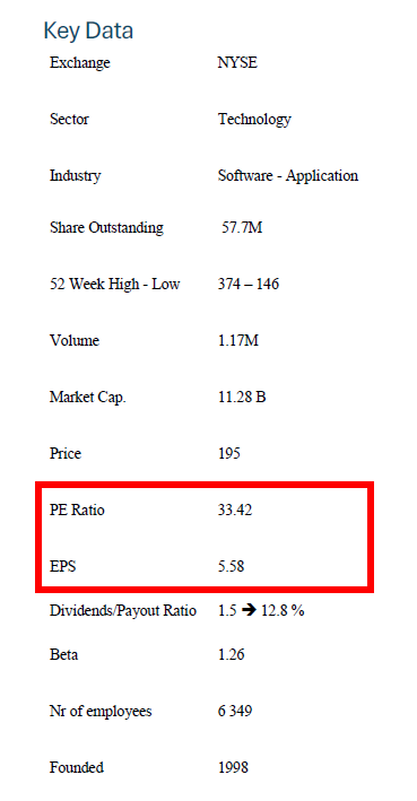 Paycom’s 1250 trading days - stock price fluctuationsHistorical daily share price chart and data for the Paycom Software since 01-08-2020 adjusted for splits. The latest closing stock price for Paycom Software as of February 01, 2024, is $190.
 ValuationOn a trailing basis, Paycom currently trades at multiples of 6.5x EV/sales, 18x EV/EBITDA, and 33x P/E. Given the growth profile of the business, it makes sense to value Paycom using a DCF approach as well. The company has a diluted share count of 57 million, that vest upon Paycom achieving an enterprise value of $10 billion. Paycom Software, Inc., a prominent cloud-based human capital management software provider, exhibits strong financial performance with a Return on Equity (ROE) of 27%, Return on Assets (ROA) of 9%. These metrics highlight the company's effective use of equity and assets to generate profit and its significant potential for continued growth. Revenue Key drivers Paycom’s revenue streaming is diversified across several operational areas including talent acquisition, time and labor management, payroll, talent management, HR management, and Global HCM applications. Additional revenue streams come from fees associated with form filings and the delivery of client payroll checks and reports. . Talent Acquisition:Paycom talent acquisition segment contributes significantly to Paycom recurring revenue through various applications: - Applicant Tracking - Candidate Tracker - Enhanced Background Checks® - Onboarding - E-Verify® - Tax Credit Services 2. Time and Labor Management:This segment includes a range of tools and applications that streamline time and labor processes: - Time and Attendance - Scheduling/Schedule Exchange - Time-Off Requests - Labor Allocation - Labor Management Reports/Push Reporting® - Geofencing/Geotracking - Microfence 3. Payroll:Paycom payroll services are comprehensive, encompassing: - Beti - Payroll and Tax Management - Vault - Everyday™ - Paycom Pay - Expense Management 4. Talent Management:Talent management is another critical area, with applications including: - Employee SelfService® - Compensation Budgeting - Performance Management - Position Management - My Analytics - Paycom Learning and Content Subscriptions 5. HR Management:The HR management segment offers a variety of tools to assist in human resPaycomces tasks: - Manager on-the-Go® - Direct Data Exchange® - Documents and Checklists - Government and Compliance - Benefits Administration/Benefits to Carrier - Benefit Enrollment Service - COBRA Administration - Personnel Action Forms - Performance Discussion Forms - Surveys - Client Action The diverse and robust nature of Paycom recurring revenue streams, underlining the company's strength in delivering a wide range of applications and services across various sectors of business operations. This diversification not only stabilizes Paycom revenue streams but also positions us to capitalize on multiple aspects of the growing digital business solutions market. The following tables provide a summary of |
| An important aspect in this field is regulation: in some places, existing regulations for traditional casinos do not apply to online casinos. Dealing with regulation and its changes is a key factor to position the business for growth and stay compliant. Europe is the most advanced and mature geographical area in the business of online casinos both in terms of demand and regulation. There, EVO has established a stable leading position (50-60% estimated market share). EVO is pursuing a structured expansion strategy in the US where the demand presents particularly high, but the state-by-state regulation set the pace of the market widening. According to the CEO. "...ability to follow up with the evolution of regulation is a competitive advantage; eventually the share of regulated markets will go up and that will make the case for (further and continuous) shift to on-line”. |  |
Financial Overviews
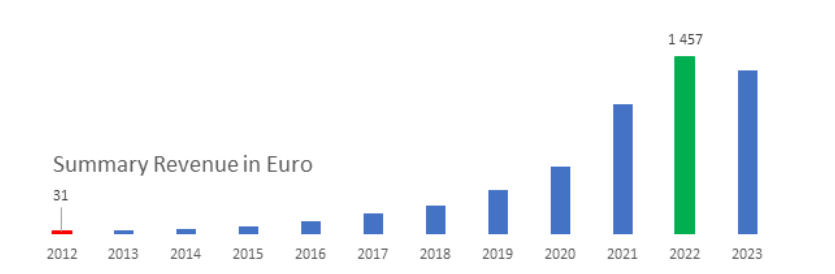
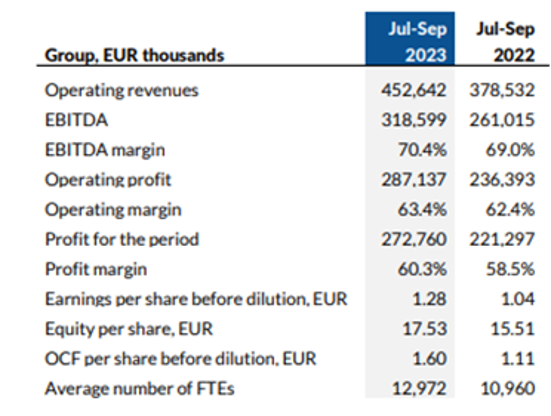
EVO is a highly profitable business in the framework of rapidly rising demand. Organic growth and expansion through strategic acquisitions represent an extraordinary mix: revenue grew at a 40% compounded rate over the last 12 years.
 | The Company successfully managed to extraordinarily expand the margins while growing rapidly. That occurred mostly thanks to the benefits of scale. Management set a very ambitious 70% EBITDA margin for 2022 despite the existing inflation pressures. My understanding is that margins are sustainable considering the limited competition and the efficiency gained by scaling up. |
Key Data
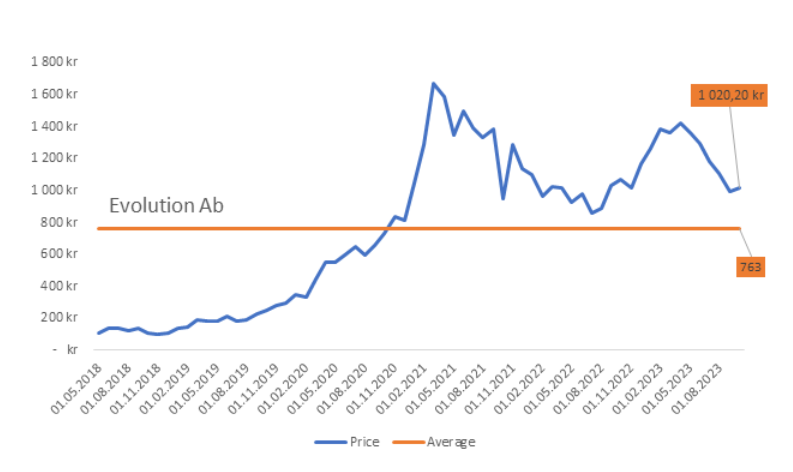
Evolution 1000 trading days - stock price fluctuations
Valuation
Evolution is an attractive long because it is the dominant provider of live casino content for online gaming operators globally with a wide moat and a multi-decadal secular growth runway ahead as online gaming grows to become a larger portion of the global gaming TAM, yet is trading near an all-time-low P/E valuation after a recent sell-off.
Revenue sources
Live casinos are roughly 30% penetrated online gaming, so is 4-5% penetrated into the overall global GGR TAM today. Live casino is an immersive player experience that enables play and interaction with real dealers on
Evolution is widely recognized as the best B2B provider of live casino games and dominates with 75-80% market share by revenue globally, supplying B2C operators such as Flutter / Draftkings / etc. with live casino content for players to play on their Ibsites. From a high level, I believe Evolution is a very high-quality business. EVO grows topline 20%+, has 70% EBITDA margins and 50% FCF margins, 100%+ tangible ROICs / 30%+ ROICs including intangibles, revenue is nearly 100% usage-based / recurring.
When I first looked at Evolution, I initially struggled to understand what if anything that EVO does is difficult to replicate.
Revenue sources
- 85% of Evolution's revenue is generated from live casino and is the focus of the investment case.
- 15% of revenue that is generated from RNG slots does not grow nor move the needle.
- Online gaming (includes
- live casino,
- RNG slot games,
- digital poker, etc.)
Live casinos are roughly 30% penetrated online gaming, so is 4-5% penetrated into the overall global GGR TAM today. Live casino is an immersive player experience that enables play and interaction with real dealers on
- blackjack,
- roulette,
- craps games, etc., live,
Evolution is widely recognized as the best B2B provider of live casino games and dominates with 75-80% market share by revenue globally, supplying B2C operators such as Flutter / Draftkings / etc. with live casino content for players to play on their Ibsites. From a high level, I believe Evolution is a very high-quality business. EVO grows topline 20%+, has 70% EBITDA margins and 50% FCF margins, 100%+ tangible ROICs / 30%+ ROICs including intangibles, revenue is nearly 100% usage-based / recurring.
When I first looked at Evolution, I initially struggled to understand what if anything that EVO does is difficult to replicate.
- EVO’s significant scale (4-10x+ larger than their nearest competitors enabling significantly higher R&D spending on game creation and tech development) creates a flywheel effect of product innovation that is difficult for competitors to match (EVO is releasing 100+ games in 2023 vs. its nearest competitor Playtech 20-25; new game releases drive player activity). Because EVO has so many resources, it can test and perfect its games more than anyone else, which enables the Company to have the best and most entertaining games that generate the highest player volumes and in turn the most revenue for operator customers. This is best evidenced by the average revenue generated per game of EVO vs. peers; talking directly to peers Playtech and Pragmatic Play, they admit EVO generates 2-3x or more revenue per game on a like-for-like basis on average (there isn't one thing I can point to for why; it's a combination of 50+ "small details" that all add up to a better game and player experience; I recommend talking to formers to understand this point).
- The unit economics of the industry supports a winner-take-most structure, which reduces the risk of competitive encroachment. EVO typically charges operator customers a 10-15% take rate on GGR; a competitor looking to gain share can come in and offer a 50% discount, or a 7.5% take rate (or more if they wanted), but unless that competitor's games can generate at least 85% of the revenue per game that EVO can generate, the operator would make less money, so is instead incentivized to stay with Evolution despite the higher take rate (e.g. the math is if EVO can generate $100 of GGR on a game less 15% EVO take rate = $85 of net gaming revenue to the operator, since competitors can only generate the equivalent of $33-50 of revenue per game on average across their portfolio relative to EVO due to the inferiority of their games, the operator would make only $31-46 of NGR by favoring a competitor's game placement over EVO's, not even close to what EVO can bring in). Competitive advantage point 1 makes it hard for competitors to generate enough revenue per game to overcome competitive advantage point 2, hence the reinforcing effect which I find attractive.
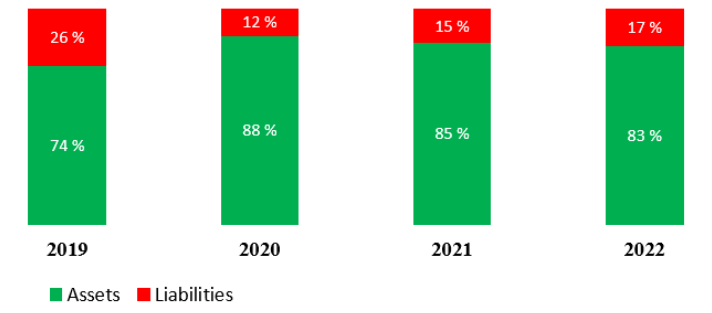
Asset and Liabilities
Management
EVO's management are excellent operators and have a strong track record of success. Martin Carlesund (CEO) is a workhorse and drives the organization forward at a fast pace of innovation. Todd Haushalter (Chief Product Officer) is widely recognized in the gaming industry as one of, if not the most brilliant minds in game design. He is the creative engine at Evolution and is a huge asset. I like that there is significant insider ownership (è17% of the company) that aligns management and the board with shareholders.
The main knock-on EVO is its revenue diversification strategy into RNG slots (purchased NetEnt and several other small RNG studios over the last several years). So far the RNG strategy has not worked as this revenue stream is roughly flattish as EVO is having to re-architect the NetEnt platform and invest more in game development, not to mention the RNG category is significantly more fragmented with significantly loIr barriers to entry and loIr take rates. I view RNG as a call option that if it can grow, great, but if not it isn't significant at only 15% of revenue and doesn't really matter for the investment case.
The main knock-on EVO is its revenue diversification strategy into RNG slots (purchased NetEnt and several other small RNG studios over the last several years). So far the RNG strategy has not worked as this revenue stream is roughly flattish as EVO is having to re-architect the NetEnt platform and invest more in game development, not to mention the RNG category is significantly more fragmented with significantly loIr barriers to entry and loIr take rates. I view RNG as a call option that if it can grow, great, but if not it isn't significant at only 15% of revenue and doesn't really matter for the investment case.
Shareholders
The founders (Jens von Bahr and Fredrik Österberg) retain a joint 10.7% stake in the Company and are board members. Richard Livingstone retains a 4.7% stake and is represented by a board member (close relative). Other board members highlight exposure to the business through equity stakes.
Management is experienced, with sizeable skin on the game and attractive economic incentives through granted options. The 3 key people are:
Management is experienced, with sizeable skin on the game and attractive economic incentives through granted options. The 3 key people are:
- The CEO Martin Carlesund, aged 52, retains 440k shares (worth SEK413m/EUR39m) and additional rights through 1,650k warrants.
- The Chief Product Officer Todd Haushalter, aged 41, retains 83k shares (worth SEK78m/EUR7m) and additional rights through 250k warrants. He joined the Company in 2015 bringing a long land-based casino experience.
- The Chief Strategy Officer Sebastian Johannisson, aged 41, has been with the Company since 2008 and retaining 892k shares (worth SEK838m/EUR80m) and additional rights through 250k warrants.
Management strategy appears very clear:
- to continue organic growth in new markets leveraging on the existing proven platform and the leadership in terms of overall offering and
- to pursue strategic acquisitions aimed at enriching the products' portfolio. My understanding is that the management is appropriately focused on the long-term success of the business (the CEO always refers to a 10-year perspective for growth and does not invite you to focus on quarterly projections/launching of new studios). According to the CEO:
Risks to consider
Regulatory
This is the most debated topic on EVO a differential view that makes comfortable with the position. 40% of EVO's revenue comes from "regulated" markets where online gaming is explicitly legalized and overseen by regulators. 60% of EVO's revenue comes from "unregulated" markets where online gaming is not overseen by regulators and there are no laws in place stipulating whether online gaming is explicitly legal or illegal. EVO does not generate revenue from geographies that are "black markets" where there are laws in place that explicitly ban online gaming (e.g. Australia, or New York State) or are U.N. sactioned countries (e.g. Iran). The debate in the stock lies in investors' opinions around EVO's unregulated exposure.
Bearish investors and some sell side analysts (who in our opinion misunderstand this topic) take the view that unregulated exposure = bad and is a big risk for EVO's business; the risk being I could wake up one day and all of a sudden a piece of EVO's business could be gone because the unregulated market revenue Int away. HoIver, I believe this view fundamentally misunderstands what unregulated revenue even means and I encourage investors to do their own diligence and speak to formers, competitors, and regulators to better understand this key dynamic. Unregulated means there are no laws in place stipulating whether the activity can take place or not. There are many parallels to other industries with similar dynamics. Take Uber for example. In some geographies like NYC, Uber is regulated where drivers must have a specific license to operate in the geography. In many other geographies, Uber is unregulated, meaning they can operate how they choose without stipulations from regulators. Many countries have laws in place that make land-based casino gaming illegal but do not cover online gaming, which enables online activity to take place, and this has been the case for years.
The risk with unregulated markets is that they can change – regulators in a geo can decide to legalize online gaming to collect tax revenue and monitor activity, which can cause temporary disruption to GGR while the regulatory process is sorted out, or they can decide to explicitly ban online gaming and make that geo black and the activity cease. HoIver, an analysis of unregulated countries over the last two decades shows the trend is overwhelmingly toward unregulated markets either staying unregulated or turning to legalized regulated markets (there are only a few isolated occurances of markets turning black; Australia being one, the U.S. being another in the mid-2000s before turning white on a state by state basis beginning in 2013 with NJ). EVO's business in Asia is the biggest question mark for investors, as nearly all countries in the region are unregulated markets. HoIver, when you drill down, this revenue is generated from a wide swath of countries from within the region with no material concentration. This is an important point that I think investors miss – how geographically diversified EVO is with no country making up more than ~5% of revenue (besides the U.S. but the U.S. is regulated state by state, so that limits exposure further). This means even if one or a few countries Ire to come out with unfavorable regulatory changes to turn white or black all at once in one year, EVO has enough other geographies growing independently that they can sustain overall growth (e.g. Germany turned from unregulated to regulated in 2021 and in the process of required operators to exit the market for a period of time. Germany was 7% of EVO's revenue and fell by 50% during this process. Despite this revenue hit, it was barely noticeable in the financials as EVO continued growing in other geos). I think the trend of unregulated markets likely staying unregulated or moving to regulated coupled with EVO's wide geographical diversity limits the regulatory risk the Company faces.
Mobile Sports Betting and iGaming Footprint
- DraftKings is live with mobile sports betting in 21 states that collectively represent approximately 44% of the U.S. population.
- DraftKings is also live with iGaming in 5 states, representing approximately 11% of the U.S. population.
- DraftKings is live with its Sportsbook and iGaming products in Ontario, Canada, which represents approximately 40% of Canada’s population.
- Kentucky, North Carolina, Vermont, and Puerto Rico have authorized mobile sports betting and collectively represent approximately 6% of the U.S. population. DraftKings expects to launch its Sportsbook product in Kentucky on September 28, 2023, as well as in North Carolina, Vermont, and Puerto Rico, in each case pending licensure and regulatory approvals as well as securing market access in North Carolina and Vermont.
- In 2023, 12 states that collectively represent approximately 24% of the U.S. population have either introduced legislation to legalize mobile sports betting or introduced bills that may result in sports wagering referendums during an upcoming election. In addition, 5 states that collectively represent approximately 14% of the U.S. population have either introduced legislation to legalize iGaming or introduced a bill that may result in an iGaming referendum during an upcoming election.
Competition.
Competitors have been trying to knock down EVO for years and many have failed while market share of the #2 and #3 players has been relatively stagnant. NetEnt tried standing up a live casino product for 7 years and finally shut it down in 2020 after not gaining any traction. Playtech has ~15% market share by revenue folloId by Pragmatic Play with ~5% market share by revenue. These two are legitimate competitors but they largely copy EVO's games and lack quality innovation of their own to displace EVO in any material way.
On Air Entertainment and a handful of other new entrants within the last 6-24 months are in various stages of building out studios in Europe and LatAm to try to break into the industry, but so far the market share of each of these players is <1% and I believe it will be difficult for them to scale outside of fringe tier 2 and tier 3 operators due to the competitive advantages of EVO I discussed.
There are also several B2C operators who are attempting to build out live casino products of their own, some for in-house use, and some for B2B white label use. That said, I believe the in-house use case will be isolated and not impactful (it's just hard for an operator to invest enough R&D to develop a competitive enough game that will only be used for their own Ibsite, whereas EVO and other third party competitors can amortize their R&D across all of their customers; the risk for an operator is if they favor their own in-house games or loIr-quality competitors' games that players don't like, those players will leave and go to other operators' Ibsites that have EVO's games), while I understand the B2B white label use case is going to be developed and rolled out slowly and incrementally (after already failing twice; this is the third try), so I do not expect any material impact to EVO from B2C operators trying to insource.
Business
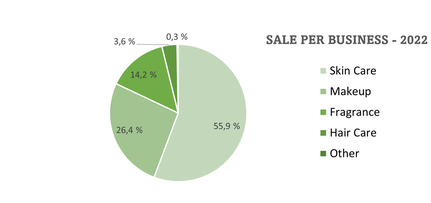
The Estée Lauder Companies Inc., founded in 1946 by Estée and Joseph Lauder, is one of the world’s leading manufacturers, marketers, and sellers of
- Quality skin care,
- Makeup,
- Fragrance and
- Hair care products.
- Their own and authorized retailer theybsites,
- On third-party online malls, in stores in
- Airports,
- In duty-free locations and in our own authorized freestanding stores.
Estee Lauder Brands
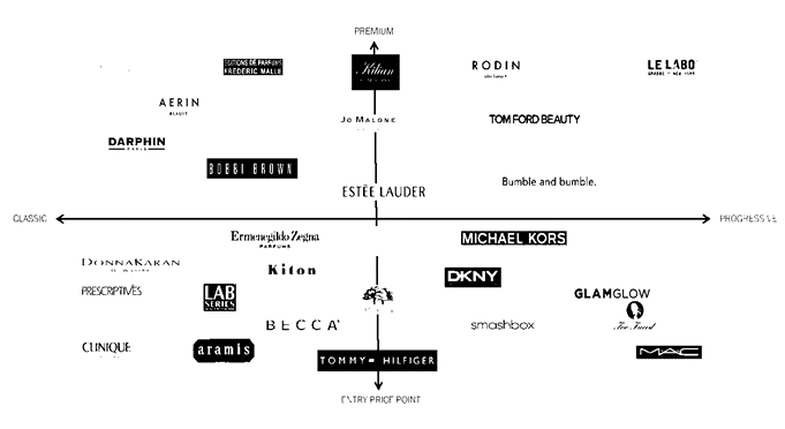
Skin Care - products address various skin care needs. These products include moisturizers, serums, cleansers, toners, body care, exfoliators, acne care and oil correctors, facial masks, and sun care products.
Makeup - Their full array of makeup products includes lipsticks, lip glosses, mascaras, foundations, eyeshadows, nail polishes and powders. Many of the products are offered in an extensive palette of shades and colors. They also sell related items such as compacts, brushes, and other makeup tools.
Fragrance - They offer a variety of fragrance products. The fragrances are sold in various forms, including eau de parfum sprays and colognes, as theyll as lotions, powders, creams, candles, and soaps that are based on a particular fragrance.
Hair Care - Their hair care products include shampoos, conditioners, styling products, treatment, finishing sprays and hair color products.
Other - They also sell ancillary products and services.

Manufacturing, Warehousing and Raw MaterialsThe company manufactures its products primarily in its own facilities located in the
To meet the increasing demand and expedite market access in the Asia/Pacific region, they began constructing a new manufacturing facility near Tokyo in fiscal 2021. The first phase of construction was completed in fiscal 2022, with the remaining site expected to be operational by early fiscal 2024. While they believe their current manufacturing network is sufficient, they strive to enhance capacity, technology, and productivity to align with regional sales demand. They have a flexible global distribution network managed by themselves or third-party logistic providers.
This network is designed to adapt to changing customer demands while maintaining service levels. They continuously evaluate and adjust their physical distribution network, especially to anticipate and respond to shifts in distribution channels. They have strategically positioned regional and local distribution centers worldwide, including those operated by third parties, to ensure efficient product delivery to customers and consumers. In fiscal 2022, they opened a state-of-the-art distribution center in Switzerland to support the growth of their travel retail business and promote sustainability initiatives. They are confident that their manufacturing and distribution capabilities can meet annual and long-term strategic objectives, although short-term fluctuations in demand may temporarily challenge capacity for specific product subcategories.
- United States,
- Belgium,
- Switzerland,
- the United Kingdom, and Canada.
To meet the increasing demand and expedite market access in the Asia/Pacific region, they began constructing a new manufacturing facility near Tokyo in fiscal 2021. The first phase of construction was completed in fiscal 2022, with the remaining site expected to be operational by early fiscal 2024. While they believe their current manufacturing network is sufficient, they strive to enhance capacity, technology, and productivity to align with regional sales demand. They have a flexible global distribution network managed by themselves or third-party logistic providers.
This network is designed to adapt to changing customer demands while maintaining service levels. They continuously evaluate and adjust their physical distribution network, especially to anticipate and respond to shifts in distribution channels. They have strategically positioned regional and local distribution centers worldwide, including those operated by third parties, to ensure efficient product delivery to customers and consumers. In fiscal 2022, they opened a state-of-the-art distribution center in Switzerland to support the growth of their travel retail business and promote sustainability initiatives. They are confident that their manufacturing and distribution capabilities can meet annual and long-term strategic objectives, although short-term fluctuations in demand may temporarily challenge capacity for specific product subcategories.
Key Data
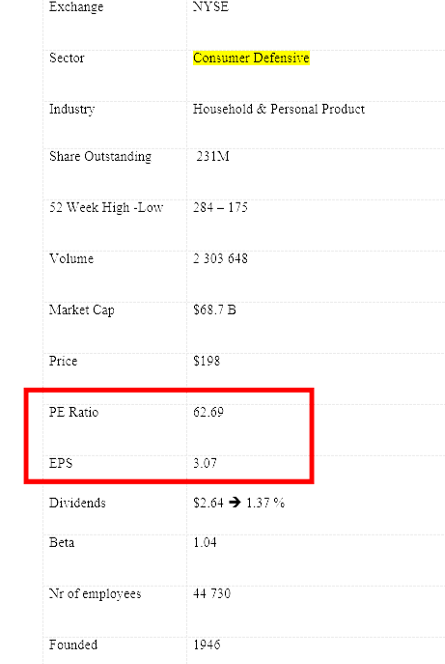
THE ESTÉE LAUDER COMPANIES INC Technnical Analysis
Historical daily share price chart and data for the Estee Lauder since 2019 adjusted for splits. The latest closing stock price for Estee Lauder as of August 04, 2023, is $172.
- The all-time high Estee Lauder's stock closing price was $370 on December 01, 2021.
- Estee Lauder's five years median stock price is $202.8 October 2020, which is 18% above the current share price.
- The Estee Lauder's 5 years third quantile stock price is $260 in February 2022, which is 51 % above the current share price.
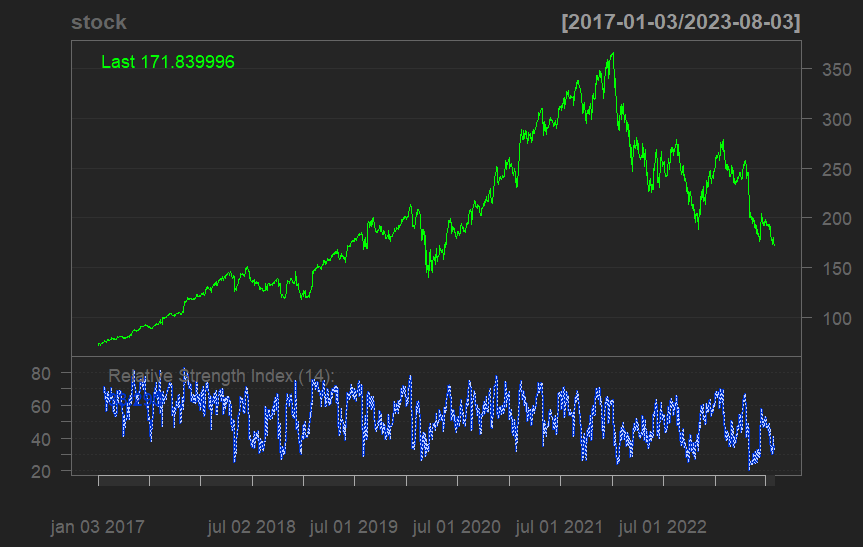
Estee Lauder's 1000 trading days stock distribution
The following tables provide a summary of
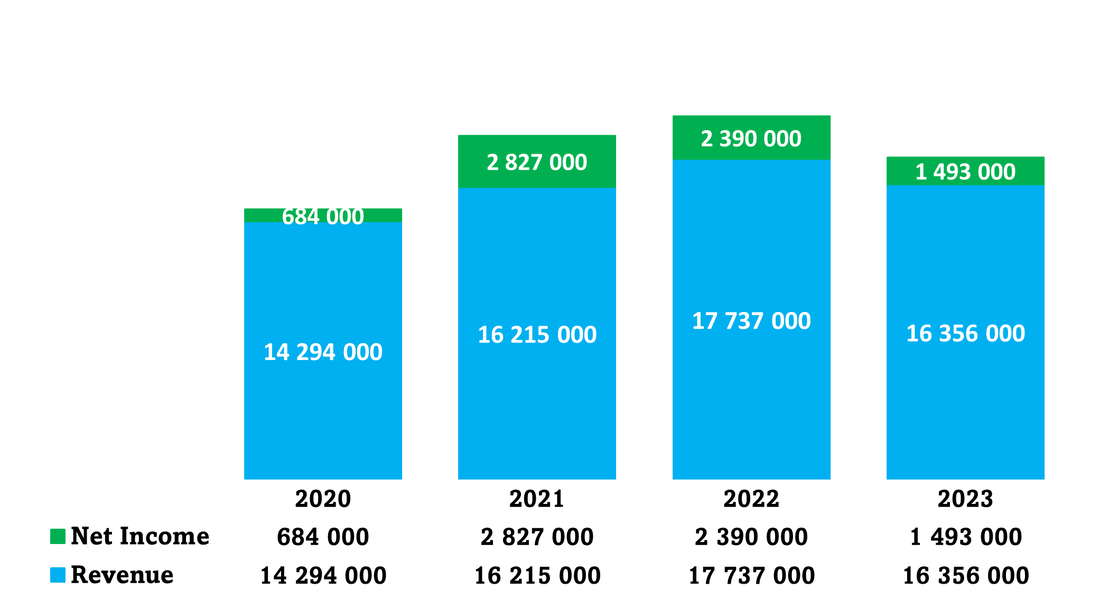
The Esêe Lauder Company. Income Statements
The Estée Lauder income statement represents the revenue for a business over the last four periods. Here's how the revenue changes over the four periods. Based on this data, we can observe a generally increasing trend in revenue from year 2020 to 2022, with a slight decrease in year 2023. It indicates that the business experienced growth in its revenue initially, followed by a slight decline.
SALES
 |  |
Competition
The company faces significant competition in the markets where it sells its skin care, makeup, fragrance, and hair care products. Consumers consider various factors such as brand recognition, product quality, accessibility, distribution channels, and price when choosing among competing products. Marketing strategies, in-store and online experiences, product demonstrations, and new innovations also influence consumers' purchasing decisions. The company acknowledges the growing interest in responsibly sourced and environmentally sustainable products, which aligns with their social impact and sustainability efforts, providing a competitive advantage.
The company competes with both global and local companies, including major multinational manufacturers and marketers such as
- L’Oréal,
- Unilever,
- Procter & Gamble, Shiseido,
- LVMH, Natura & Co., Chanel,
- Beiersdorf, Coty, Kao Corp, and LG Household & Health Care.
Performance
The quarterly data shows a mix of positive and negative growth rates. There are quarters with significant positive growth, such as Jun. 19 (23.5%), Sep. 19 (20.1%), and Mar. 21 (33.0%). However, there are also quarters with significant negative growth, such as Jun. 20 (-13.6%), Mar. 22 (-37.3%), and Jun. 22 (-46.0%). Overall, the data indicates fluctuations in growth over the specified period, with both periods of expansion and contraction.
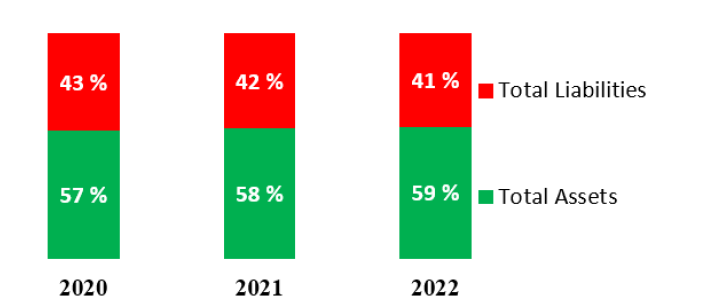
Financial Health of Estee Lauder
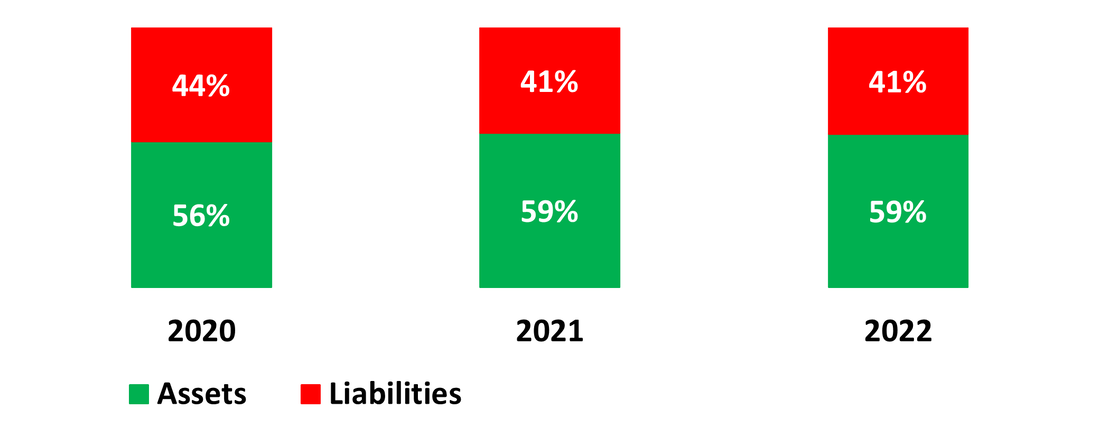
In summary, the company's total assets, total liabilities, and equity/net worth have changed over the three years. It is important we note that this data alone does not provide enough information to draw definitive conclusions about the financial health or performance of the company. Additional financial statements, such as income statements and cash flow statements, would be necessary for a more comprehensive analysis.
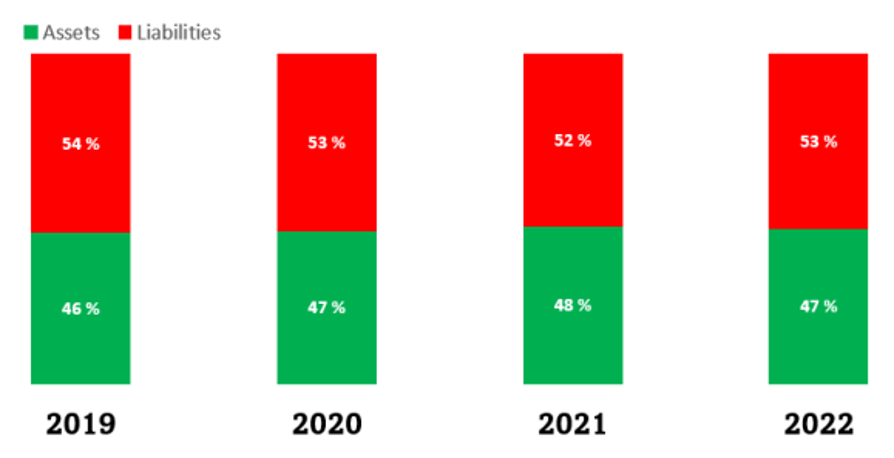
These trends indicate fluctuations in Estee Lauder assets and liabilities over the three-year period. However, we prefer to see assets are greater than liabilities.
These trends indicate fluctuations in Estee Lauder assets and liabilities over the three-year period. However, we prefer to see assets are greater than liabilities.
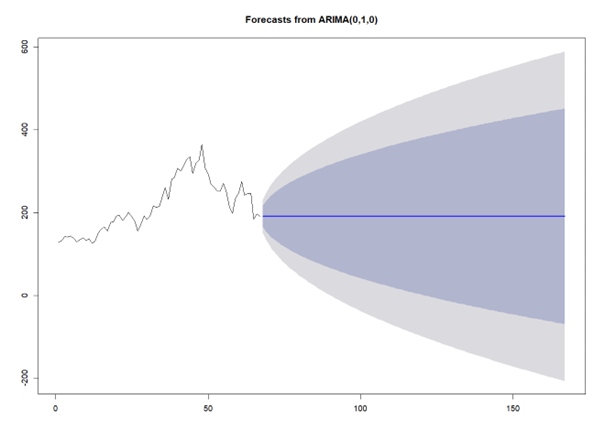
Estee Lauder Price forecast
Business
McDonald’s Corporation (MCD) is a Global foodservice retailer that operated and franchised a total of 40,275 restaurants worldwide in 2022, up from 40,031 restaurants in 2021. The company has seen a year-over-year increase in restaurants for the last 17. Market-share leading quick service restaurant (QSR) with over 40 000 restaurants, $88bn systemwide sales, and $23bn revenue globally.
- Dominant player in largest QSR sub-category: burgers
- Geographically diversified – in terms sales:
- 48 % International
- 41 % U.S.A.
- 12 % Others.
- Brand royalty = 4% of sales
- Rent = 9% of sales (in cases where MCD owns the underlying real estate)
- Royalties and rent contribute to 75% of total EBITDA.
Key Data
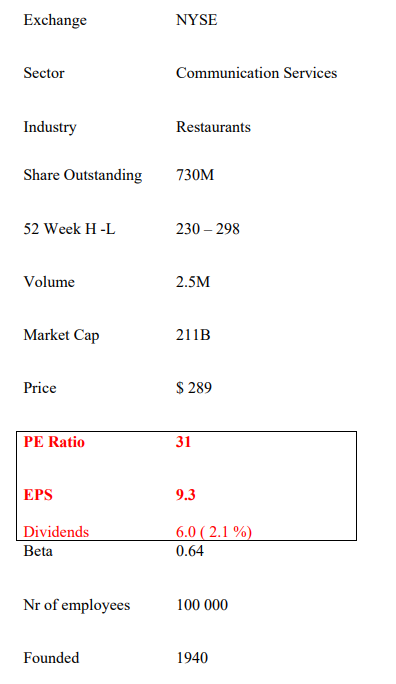
McDonald's Technnical Analysis
Historical daily share price chart and data for McDonald's since 2019 adjusted for splits. The latest closing stock price for McDonalds as of July 05, 2023, is $295.
- The all-time high McDonald's stock closing price was $298 on April 01, 2023.
- McDonald's 5 years median stock price is $200 in October 2020, which is 32.2% below the current share price.
- McDonald's 5 years third quantile stock price is $240 in February 2023, which is 18.6% below the current share price.
- The 5 years average McDonald's stock price is $204.9. We can see the red line in the following chart.
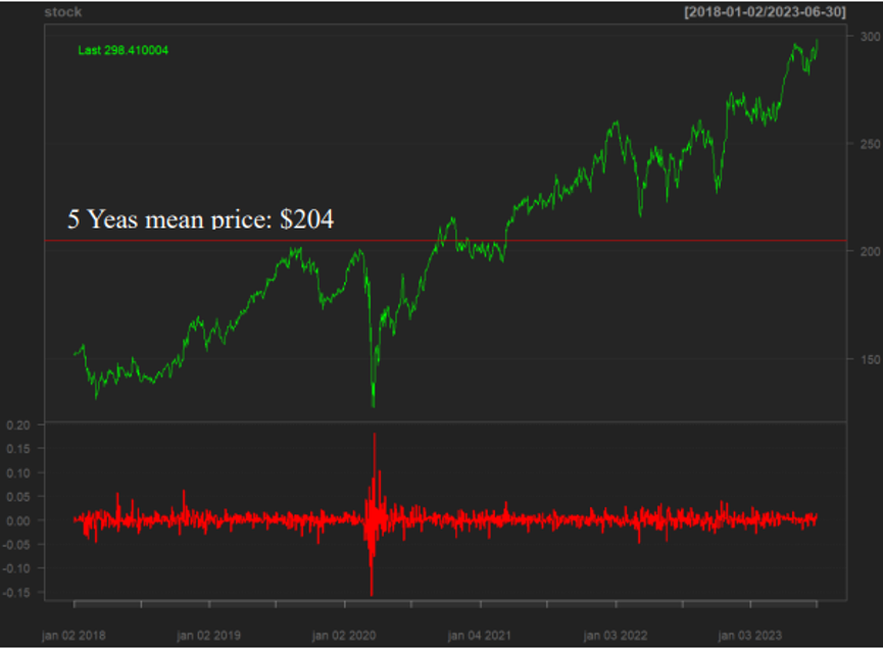
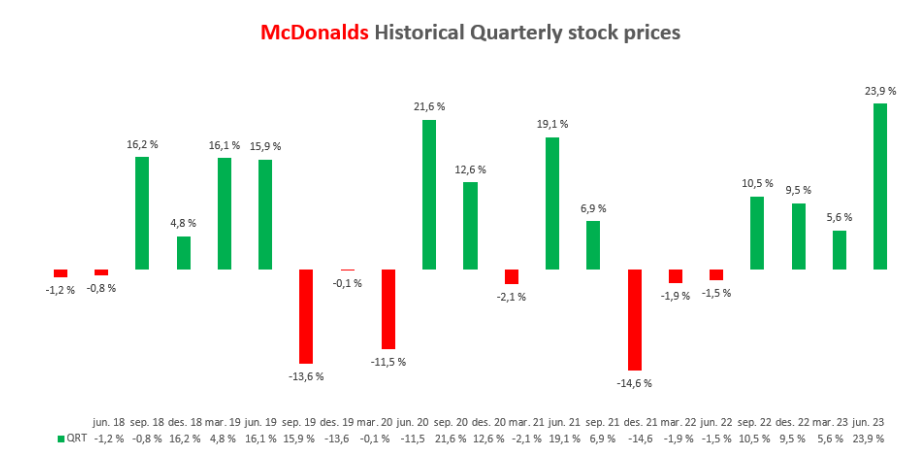
McDonald's 1000 trading days stock distribution
Valuation – Performance
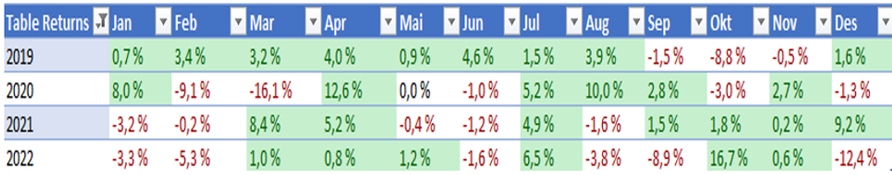
Breaking down and examining the percentage changes for each month for the year 2022. Volatility, the stock price of McDonald's appears to have experienced significant volatility throughout the year. Large positive and negative percentage changes indicate substantial fluctuations in market sentiment and investor perceptions. Overall Performance, while there are periods of positive performance, such as March, April, May, July, and October, there are also significant declines in other months, such as February, June, August, September, November, and December, and improved in last six months.
How does McDonalds Make money ?McDonald’s franchised restaurants are owned and operated under one of the following.
The Company is primarily a franchisor and believes franchising is paramount to
- Structures - conventional franchise,
- Developmental license or affiliate.
The Company is primarily a franchisor and believes franchising is paramount to
- Delivering great-tasting food,
- Locally relevant customer experiences and
- Driving profitability.
Franchising enables an individual to be their own employer and maintain control over all employment related matters, marketing, and pricing decisions, while also benefiting from the strength of McDonald’s global brand, operating system and financial resources.
Directly operating McDonald’s restaurants contributes significantly to the Company's ability to act as a credible franchisor. One of the strengths of the franchising model is that the expertise from operating Company-owned restaurants allows McDonald’s to improve the operations and success of all restaurants while innovations from franchisees can be tested and, when viable, efficiently implemented across relevant restaurants. Having Company-owned and operated restaurants provides Company personnel with a venue for restaurant operations training experience. In addition, in our Company-owned and operated restaurants, and in collaboration with franchisees, the Company is able to further develop and refine operating standards, marketing concepts and product and pricing strategies that will ultimately benefit McDonald’s restaurants.
The Company’s revenues consist of sales by Company-operated restaurants and fees from restaurants operated by franchisees. Fees vary by type of site, amount of Company investment, if any, and local business conditions. These fees, along with occupancy and operating rights, are stipulated in franchise/license agreements that generally have 20-year terms. The Company’s Other revenues are comprised of fees paid by franchisees to recover a portion of costs incurred by the Company for various technology platforms, revenues from brand licensing arrangements to market and sell consumer packaged goods using the McDonald’s brand and, for periods prior to its sale on April 1, 2022, third-party revenues for the Company's Dynamic Yield business.
Conventional Franchise
Under a conventional franchise arrangement, the Company generally owns or secures a long-term lease on the land and building for the restaurant location and the franchisee pays for equipment, signs, seating and décor. The Company believes that ownership of real estate, combined with the co-investment by franchisees, enables it to achieve restaurant performance levels that are among the highest in the industry.
Franchisees are responsible for reinvesting capital in their businesses over time. In addition, to accelerate implementation of certain initiatives, the Company may co-invest with franchisees to fund improvements to their restaurants or operating systems. These investments, developed in collaboration with franchisees, are designed to cater to consumer preferences, improve local business performance and increase the value of the McDonald's brand through the development of modernized, more attractive, and higher revenue generating restaurants.
Financial Health
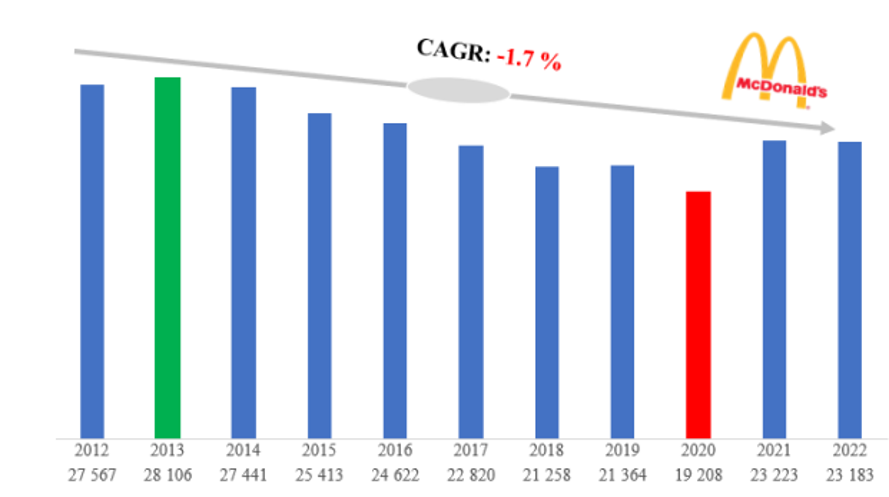
McDonald’s compound annual average growth rate since 2012 is unimpressed of -1.72 %. Continuously present in the international market operations are slowing significant to McDonald’s revenues and net income. International revenues accounted for approximately 61% of their consolidated revenues in 2022.
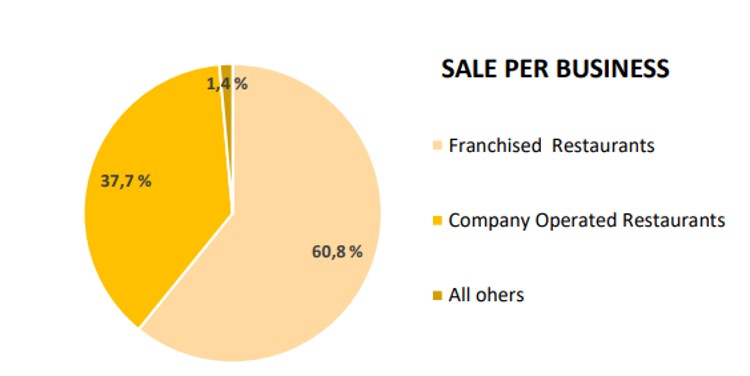
Sources of revenues: Sales per businessMcDonald's Corporation is the world's biggest fast-food chain. Net sales break down by type of restaurants as follows:
- Franchised and affiliated restaurants (60.8%): owned, at the end of 2022, +40 000 franchises (of which 7,775 affiliates).
- Company-operated restaurants (37.7%): 2,736 restaurants.
- Other (1.4%).
- 61.8% of net sales are abroad.
Franchised margins represented nearly 90% of restaurant margin dollars.
Total restaurant margin growth was negatively impacted in both periods by foreign currency translation due to the weakening of all major currencies against the U.S. Dollar. Franchised margins in the U.S. reflected higher depreciation costs related to investments in restaurant modernization. Company-operated margins in the U.S. and International Operated Markets segment reflected positive sales performance driven by strategic menu price increases, and the negative impact of inflationary pressures. Results in the International Operated Markets segment were also negatively impacted by the restaurant closures in Russia and Ukraine. Total restaurant margins included $1,501 million of depreciation and amortization expenses in 2022.
Total restaurant margin growth was negatively impacted in both periods by foreign currency translation due to the weakening of all major currencies against the U.S. Dollar. Franchised margins in the U.S. reflected higher depreciation costs related to investments in restaurant modernization. Company-operated margins in the U.S. and International Operated Markets segment reflected positive sales performance driven by strategic menu price increases, and the negative impact of inflationary pressures. Results in the International Operated Markets segment were also negatively impacted by the restaurant closures in Russia and Ukraine. Total restaurant margins included $1,501 million of depreciation and amortization expenses in 2022.
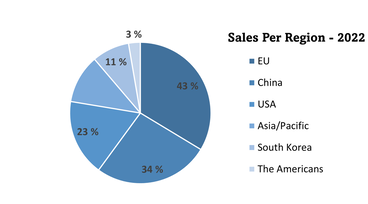
Sales per region
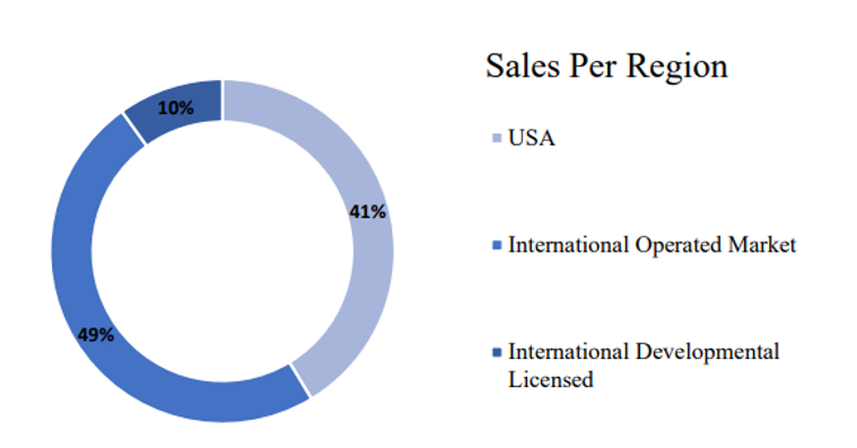
Net sales are distributed geographically as follows: the United States (41%), International operate markets (49%), and international development licensed (10).
As the home country of McDonald's, the United States has traditionally been one of its largest markets. McDonald's has a strong presence across the country, and the U.S. market accounts for a substantial portion of its global sales. In the western area we find that McDonald's has a significant presence in various European countries. Major markets in Europe include the United Kingdom, Germany, France, among others. Europe has been an important region for McDonald's in terms of sales and market share. However, other regions, such as Latin America, the Middle East, and Africa. These regions contribute to McDonald's overall sales, albeit to a lesser extent compared to the previously mentioned regions.
As the home country of McDonald's, the United States has traditionally been one of its largest markets. McDonald's has a strong presence across the country, and the U.S. market accounts for a substantial portion of its global sales. In the western area we find that McDonald's has a significant presence in various European countries. Major markets in Europe include the United Kingdom, Germany, France, among others. Europe has been an important region for McDonald's in terms of sales and market share. However, other regions, such as Latin America, the Middle East, and Africa. These regions contribute to McDonald's overall sales, albeit to a lesser extent compared to the previously mentioned regions.
Competitors
McDonald’s restaurants compete with international, national, regional, and local retailers of traditional, fast casual and other food service competitors. The Company measures its competitive position within the informal eating out ("IEO") segment, which is inclusive of the Company's primary competition of quick-service restaurants, but also includes 100% home delivery/takeaway providers, street stalls or kiosks, cafés, specialist coffee shops, self-service cafeterias, and juice/smoothie bars. The Company competes among quick-service restaurants primarily on the basis of price, convenience, service, experience, menu variety and product quality.
Intense competition
McDonald’s competes primarily in the IEO segment, which is highly competitive. They also face sustained, intense competition from traditional, fast casual and other competitors, which may include many non-traditional market participants such as convenience stores, grocery stores, coffee shops and online retailers. They expect their environment to continue to be highly competitive, and our results in any particular reporting period may be impacted by a contracting IEO segment or by new or continuing actions, product offerings or consolidation of their competitors and third-party partners, which may have a short- or long-term impact on their results. McDonald competes primarily on the basis of product choice, quality, affordability, service, and location.
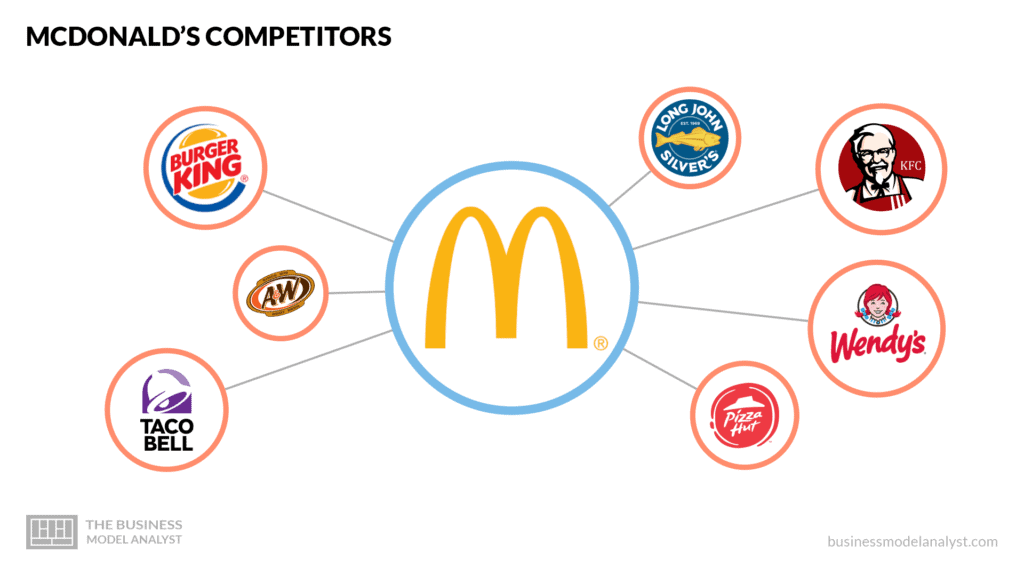
Fast food industry competitorsMcDonald's faces competition from several companies in the fast-food industry. Here are some of its major competitors:
Burger King: Burger King is a global fast-food chain that offers a similar menu to McDonald's, including burgers, fries, and chicken items. It is known for its flame-grilled burgers and has a strong presence in the United States and other countries.
Wendy's: Wendy's is another prominent fast-food chain that competes with McDonald's. It differentiates itself by offering a "fresh, never frozen" slogan for its beef patties and a menu that includes salads, chicken sandwiches, and Frosty desserts.
Subway: Although Subway is primarily known for its sandwiches, it competes with McDonald's by offering quick-service options. Subway emphasizes its healthier menu choices, including a variety of fresh ingredients and customization options.
KFC: Kentucky Fried Chicken (KFC) is a popular fast-food chain specializing in fried chicken. While its focus is different from McDonald's, it competes in the fast-food industry and has a significant global presence.
Taco Bell: Taco Bell is a fast-food chain known for its Mexican-inspired menu, including tacos, burritos, and quesadillas. While its offerings differ from McDonald's, it competes for customers seeking quick-service dining options.
Chipotle Mexican Grill: Chipotle is a fast-casual chain known for its customizable burritos, bowls, and tacos. While it operates in a slightly different segment, it competes for customers seeking quick and customizable dining options.
In-N-Out Burger: In-N-Out Burger is a regional chain in the western United States. It is known for its fresh, made-to-order burgers and limited menu. Despite its smaller footprint, In-N-Out Burger has a loyal customer base and competes for customers looking for quality fast-food options.
Intense competition
McDonald’s competes primarily in the IEO segment, which is highly competitive. They also face sustained, intense competition from traditional, fast casual and other competitors, which may include many non-traditional market participants such as convenience stores, grocery stores, coffee shops and online retailers. They expect their environment to continue to be highly competitive, and our results in any particular reporting period may be impacted by a contracting IEO segment or by new or continuing actions, product offerings or consolidation of their competitors and third-party partners, which may have a short- or long-term impact on their results. McDonald competes primarily on the basis of product choice, quality, affordability, service, and location.
Fast food industry competitorsMcDonald's faces competition from several companies in the fast-food industry. Here are some of its major competitors:
Burger King: Burger King is a global fast-food chain that offers a similar menu to McDonald's, including burgers, fries, and chicken items. It is known for its flame-grilled burgers and has a strong presence in the United States and other countries.
Wendy's: Wendy's is another prominent fast-food chain that competes with McDonald's. It differentiates itself by offering a "fresh, never frozen" slogan for its beef patties and a menu that includes salads, chicken sandwiches, and Frosty desserts.
Subway: Although Subway is primarily known for its sandwiches, it competes with McDonald's by offering quick-service options. Subway emphasizes its healthier menu choices, including a variety of fresh ingredients and customization options.
KFC: Kentucky Fried Chicken (KFC) is a popular fast-food chain specializing in fried chicken. While its focus is different from McDonald's, it competes in the fast-food industry and has a significant global presence.
Taco Bell: Taco Bell is a fast-food chain known for its Mexican-inspired menu, including tacos, burritos, and quesadillas. While its offerings differ from McDonald's, it competes for customers seeking quick-service dining options.
Chipotle Mexican Grill: Chipotle is a fast-casual chain known for its customizable burritos, bowls, and tacos. While it operates in a slightly different segment, it competes for customers seeking quick and customizable dining options.
In-N-Out Burger: In-N-Out Burger is a regional chain in the western United States. It is known for its fresh, made-to-order burgers and limited menu. Despite its smaller footprint, In-N-Out Burger has a loyal customer base and competes for customers looking for quality fast-food options.
SWOT ANALYSIS
McDonald’s strengthOne of the strengths of the franchising model is that the expertise from operating Company-owned restaurants allows McDonald’s to improve the operations and success of all restaurants while innovations from franchisees can be tested and, when viable, efficiently implemented across relevant restaurants. Having Company-owned and operated restaurants provides Company personnel with a venue for restaurant operations training experience. In addition, in our Company-owned and operated restaurants, and in collaboration with franchisees, the Company is able to further develop and refine operating standards, marketing concepts and product and pricing strategies that will ultimately benefit McDonald’s restaurants.
Global presence: McDonald's is one of the world's largest fast-food chains, with a presence in over 100 countries. Its widespread network of restaurants gives it a significant advantage over competitors.
Brand recognition: McDonald's is a highly recognized and iconic brand globally. It has built a strong brand image over the years, which helps in attracting customers and driving sales.
Diversified menu: McDonald's offers a diverse menu with a wide range of options, catering to different tastes and preferences. This allows them to attract a broader customer base and adapt to changing consumer demands.
Operational efficiency: McDonald's has a well-established and efficient operating system, which enables them to maintain consistent quality, speed, and service across their restaurants. This efficiency helps them in delivering a consistent customer experience.
Strong franchising model: McDonald's operates on a franchising model, which allows them to expand rapidly without significant capital investment. Franchisees bear the cost and operational responsibilities, while McDonald's benefits from franchise fees and royalties
McDonalds OpportunityCommit to the Core menu by tapping into customer demand for the familiar and focusing on serving our iconic products such as our World Famous Fries, the Big Mac, our Chicken McNuggets and the McFlurry. Around the world, McDonald’s possesses 10 of these "billion-dollar brand equities." The Company will continue to improve on its classics by implementing a series of operational and formulation changes designed to deliver hotter, juicer, tastier burgers across the globe. While leaning into core icons like Chicken McNuggets, ongoing focus will include scaling emerging equities such as the McSpicy and McCrispy Chicken Sandwiches. The Company also continues to see a significant opportunity with coffee, demonstrated by markets leveraging the McCafé brand, customer experience, value and quality to drive long-term growth.
Expansion in emerging markets: McDonald's can capitalize on the growing middle-class populations and changing lifestyles in emerging markets, such as Africa region, China and India. These markets offer significant opportunities for growth and expansion.
Focus on healthier options: There is an increasing demand for healthier food choices. McDonald's can continue to enhance its menu with healthier alternatives, such as salads, grilled options, and organic ingredients, to attract health-conscious consumers.
Technology integration: McDonald's can leverage technology to improve customer experience and operational efficiency. This includes implementing self-order kiosks, mobile ordering and payment systems, and delivery services to cater to changing consumer preferences and convenience.
McDonald’s TreatsIntense competition: The fast-food industry is highly competitive, with numerous global and local players. McDonald's faces competition from both traditional fast-food chains and newer, innovative concepts, which could impact on its market share and profitability.
Changing consumer preferences: Consumer preferences and trends can change rapidly, and if McDonald's fails to adapt to these changes, it risks losing customers to competitors who offer more appealing options.
Regulatory pressures: McDonald's operates in multiple countries, each with its own regulations and policies related to labor, food safety, and advertising. Complying with these regulations can be challenging and costly, and changes in regulations can impact the company's operations and profitability.
McDonald’s Weakness
Health concerns: McDonald's has faced criticism for the nutritional value of its food offerings. As consumer preferences shift towards healthier options, McDonald's has had to adapt its menu to include healthier choices, but it still faces challenges in changing its perception as a fast-food chain associated with unhealthy food.
Dependence on franchisees: While the franchising model is a strength, it also poses a risk as McDonald's depends heavily on its franchisees for the consistent operation of its restaurants. If franchisees face financial or operational difficulties, it could impact McDonald's brand image and customer experience.
Vulnerability to market fluctuations: As a global company, McDonald's is exposed to currency exchange rate fluctuations, changes in labor costs, and economic downturns in different markets. Such factors can affect its profitability and financial performance.
McDonald's Financial Health
McDonald's Corporation has generally been considered financially healthy. Here are some key points regarding McDonald's financial health: Revenue and profitability: McDonald's has consistently generated significant revenue and maintained a strong level of profitability. Its global presence and brand recognition have contributed to its ability to generate sales and drive profitability. McDonald's operates primarily on a franchising model, which has proven to be financially beneficial. Franchisees contribute to the company's revenue through franchise fees and ongoing royalties, while also bearing the costs of operating individual restaurants. This model allows McDonald's to expand without significant capital expenditure and helps in maintaining a steady cash flow. As today McDonald’s have a strong cash flow: McDonald's has historically demonstrated strong cash flow generation, which is essential for supporting
ongoing operations, investing in new initiatives, and returning value to shareholders through dividends and share repurchases. Adaptability, investment in technology and innovation, McDonald's has been investing in technology initiatives to enhance customer experience and operational efficiency. This includes digital ordering and payment systems, self-order kiosks, and delivery services. Such investments can position the company for future growth and competitiveness. However, it’s important to note that while McDonald's has generally maintained a strong financial position, it faces challenges and risks that can impact its financial health. These include factors like changing consumer preferences, intense competition, and economic conditions in different markets and their liabilities are greater than their assets.
Managements
Chris Kempczinski (54 Y)
3.7 years average management tenure
US$17,770,514 Compensation
Mr. Christopher J. Kempczinski, also known as Chris, has been the President, Chief Executive Officer, and Director at McDonald's Corporation since November 1, 2019. He serves as an Independent Director at The Procter & Gamble Company since October 12, 2021. He served as President of USA at McDonald's Corporation since January 1, 2017, until 2019.
He served as President at McDonald's USA, LLC since January 01, 2017, until 2019. He served as Executive Vice President of Strategy, Business Development & Innovation at McDonald's Corporation since October 26, 2015, until December 2016. He first joined McDonald’s in 2015, overseeing global strategy, business development and innovation. He oversaw all aspects of strategy development, planning, innovation, and new concepts to drive growth for the company.
He served as the President of International and Executive Vice President of Growth Initiatives at Kraft Foods Group, Inc., since February 12, 2015, until September 2015. He served as the President of Kraft Canada Inc since July 2012 until December 2014 and served as Senior Vice President - U.S. Grocery from December 2008 to July 2012. Before joining McDonald, he held several leadership roles at The KraftHeinz Company (packaged food), including Executive Vice President at Kraft Foods Group, Inc since January 29, 2014 until February 2015.
He leads Kraft’s Canadian business unit overseeing all aspects of supply chain, sales, marketing, human resources and research, development, and quality. He has full P&L responsibility for the business including beloved brands such as Kraft Dinner, Kraft Peanut Butter, Cracker Barrel natural cheeses and Nabob coffee. During his time with Kraft Canada, he has led the business unit through transformative change with the separation from Mondelez International in October 2012 and later restructuring the organization’s resources to focus on simplification and innovation. He joined Kraft in 2008 as Senior Vice President overseeing brands in the meals and enhancers categories with iconic brands like Kraft Macaroni & Cheese and Kraft dressings.
Ownership
- Institutions: 70 %
- General Public: 29
- Individual Insiders: 0.21%
- Number of institutions holding shares: 3619
Top McDonalds's - Shareholders
Business
Bayer AG operates as a life science company worldwide, it is one of the world's leaders in designing, producing, and marketing,
The Consumer Health segment markets nonprescription over-the-counter medicines, medical products, medicated skincare products, nutritional supplements, and self-care solutions in dermatology, nutritional supplements, pain and cardiovascular risk prevention, digestive health, allergy, and cold and cough.
The Crop Science segment offers chemical and biological crop protection products, improved plant traits, seeds, digital solution, and pest and weed control products, as well as customer service for agriculture. This segment also provides
Net sales are distributed by product family as follows:
- Pharmaceutical products,
- Consumer Health, and
- Crop Science/agrochemicals.
The Consumer Health segment markets nonprescription over-the-counter medicines, medical products, medicated skincare products, nutritional supplements, and self-care solutions in dermatology, nutritional supplements, pain and cardiovascular risk prevention, digestive health, allergy, and cold and cough.
The Crop Science segment offers chemical and biological crop protection products, improved plant traits, seeds, digital solution, and pest and weed control products, as well as customer service for agriculture. This segment also provides
- breeding,
- propagation, and
- production/processing of seeds, including seed dressing.
Net sales are distributed by product family as follows:
- agrochemicals (49.6%): herbicides, fungicides, insecticides, etc.
- pharmaceutical products (37.9%): intended for the prevention and treatment of cardiovascular and respiratory diseases, diabetes, nervous system disorders, etc.;
- OTC products and nutritional supplements (12%);
- other (0.5%).
Bayer Brand’s Portfolio

As we see in the picture above, Bayer AG owns and markets a wide range of brands across its different business segments. Some of the notable brands include pharmaceuticals, such Aspring, Xarelo, Adalat, Levitra and Nexavar. Bayern’s widely recognized agriculture brands are Roundup, Dekalb, Seresto, Poncho and Basta, in addition to the agriculture and pharmaceuticals brand, Bayern owns a trusted and popular brand such as Claritin, Alveve and DR. Scoll’s.
Key Data
Bayer AG - Technical Analysis
Historical daily share price chart and data for Bayer AG since 2017 adjusted for splits. The latest closing stock price for Bayer as of April 08, 2023, is 60.
- The all-time high BAYER stock closing price was 137.65 on March 01, 2015.
- The BAYER 5 years median stock price is 15.82, which is 73.6% below the current share price.
- The BAYER 5 years third quantile stock price is 21.63, which is 63.4% below the current share price.
- The 5 years average BAYER stock price is 17.68. We can see the red line in the following chart.
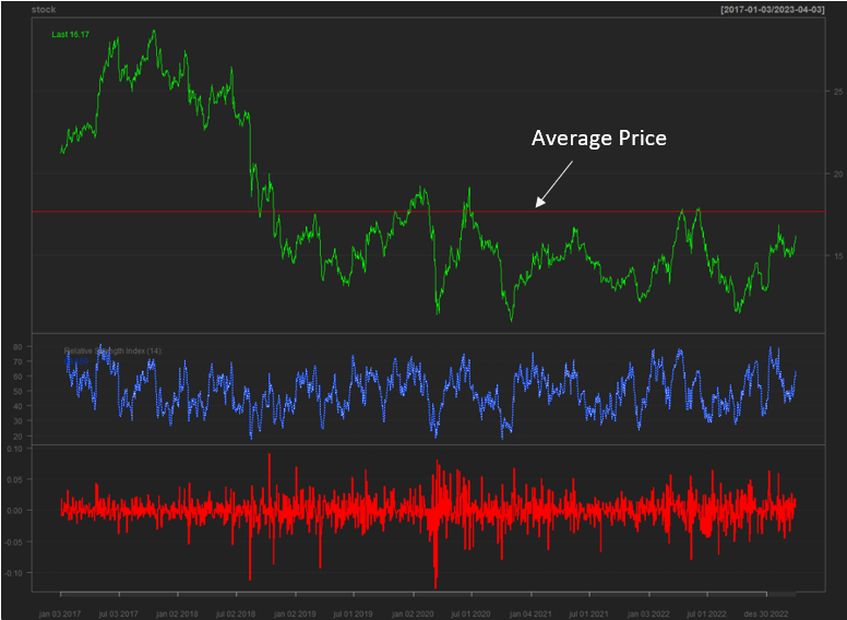
It is with a good reason once, George Box said, “ All models are wrong, but some are useful”.
Many widely used financial models assume a normal distribution of stock price returns, despite increasing evidence that this is not the case. These assumptions ignore the real chances of extreme events and fluctuations occurring, as we can see few declines greater than 8 %, with one recently in March 2020 decline over 10% in ROC model, therefore we can observe they underestimate the risk of investing in the market.
Briefly the most significant difference in the case between normal and power law distributions is tail size. Power law distributions have fatter tails than normal distributions, meaning that the probability of extreme events happening is much higher in power law distributions than in those that are normal.
When we look at BAYER last 1000 trading days distribution, it is clear that 80 % of the price fluctuation falls within the range of [ 13 to 16].
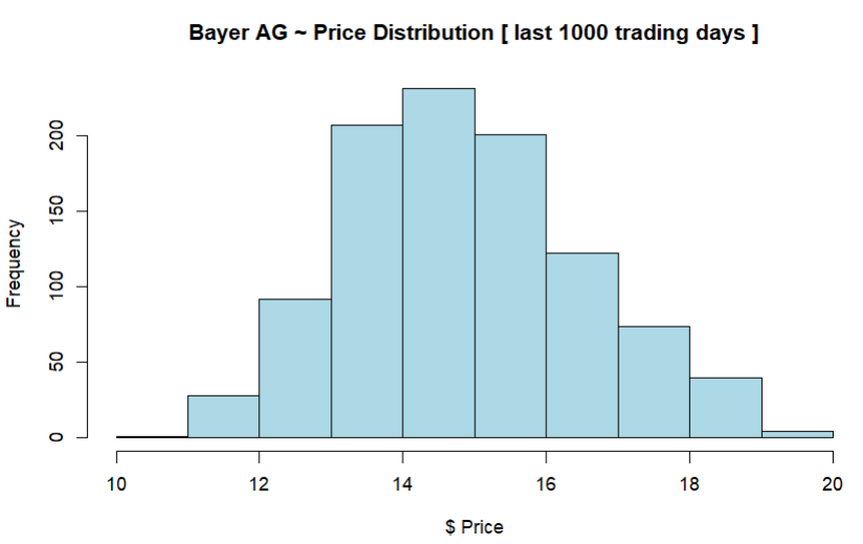
BAYRY Yearly Adjusted price
2017-12-29 25.22
2018-12-31 21.79
2019-12-31 15.70
2020-12-31 15.20
2021-12-31 14.32
2022-12-30 14.49
2023-04-03 15.30
2017-12-29 25.22
2018-12-31 21.79
2019-12-31 15.70
2020-12-31 15.20
2021-12-31 14.32
2022-12-30 14.49
2023-04-03 15.30
Financial Healthy
Bayer is leader in life sciences, it aims to improve health and spread health around the world by focusing on innovation and sustainability core competitive advantage. As date April 2023 Bayer is the world's 229th most valuable company by market cap according to our data.
The following chart provide a summary of
BAYER AG. Income Statements
The following chart provide a summary of
BAYER AG. Income Statements
Eleven-years compound annual growth rate in revenue.
The revenue CAGR for Bayer (BAYN.BE) stock is 0.37% for the period of 2022. Compound annual growth rate (CAGR) is a commonly used business and investing term that measures the growth of a metric over multiple periods. CAGRs are useful since they reduce the effect of volatility in specific periods, unlike arithmetic means. We can conclude that Bayer has one of the worst CAGR within the blue-chip companies.
The revenue CAGR for Bayer (BAYN.BE) stock is 0.37% for the period of 2022. Compound annual growth rate (CAGR) is a commonly used business and investing term that measures the growth of a metric over multiple periods. CAGRs are useful since they reduce the effect of volatility in specific periods, unlike arithmetic means. We can conclude that Bayer has one of the worst CAGR within the blue-chip companies.
What do they offer ?
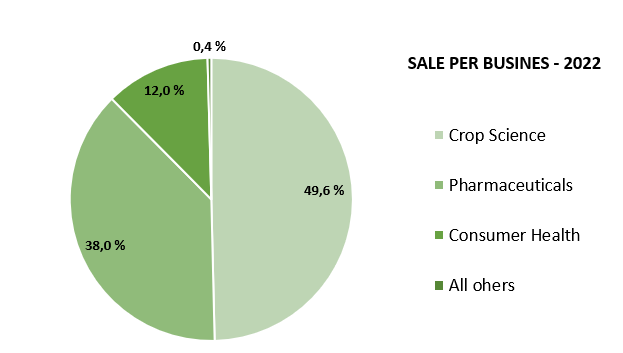 | It is clear that Corp Science is the most valuable segment for Bayer. Corp revenue covers half of the Bayer revenue channel streaming. This is due to the landscape changing in agriculture: the |
Valuation
Price to Earnings Ratio vs IndustryBayer AG ~ Price-To-Earnings vs Peers: As date April 2023 BAYN is good value based on its Price-To-Earnings Ratio 14.3x compared to the peer average 27.8x.
Performance Highlights
Performance Highlights
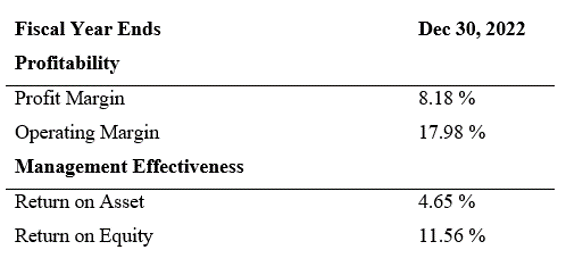
Bayer AG generates 8 cents for each dollar of sales, while Eli Lilly, which operates in the same sector generates 3x than Bayer. Based on the latest financial disclosure, Bayer AG performs far less than that of the drag manufactures sector and significantly less than that of the pharmaceuticals industry. The P/E ratio is an excellent indicator that we can rely on while investing in equites. Comparing Bayer’s P/E ratio and market cap
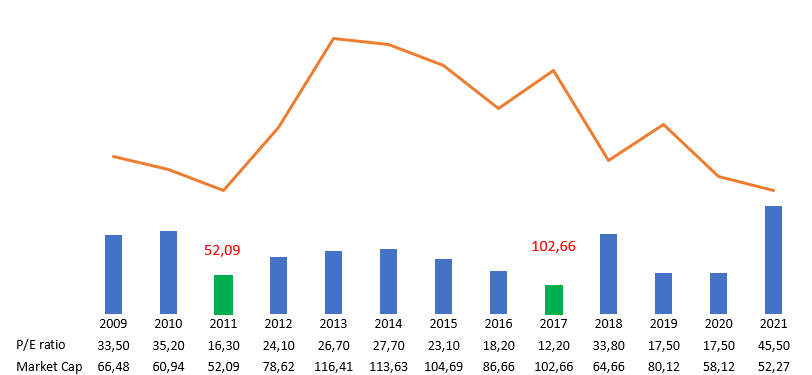
Since a stock's share price can swing wildly from day to day and week to week, we had argued that a market cap is not really the best way to determine what a company is worth. Using discounted cash flow analysis is a more useful way to value a company (and thus know what to pay for its shares), though as with any valuation method it has its own flaws.
Bayer’s Monthly Performance
We notice that on the table, Bayern overall had bad performance for several years.
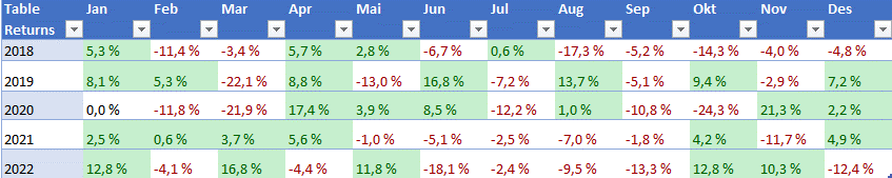
Bayer AG - Competitors
Bayer’s products and services are designed to benefit people and improve their quality of life
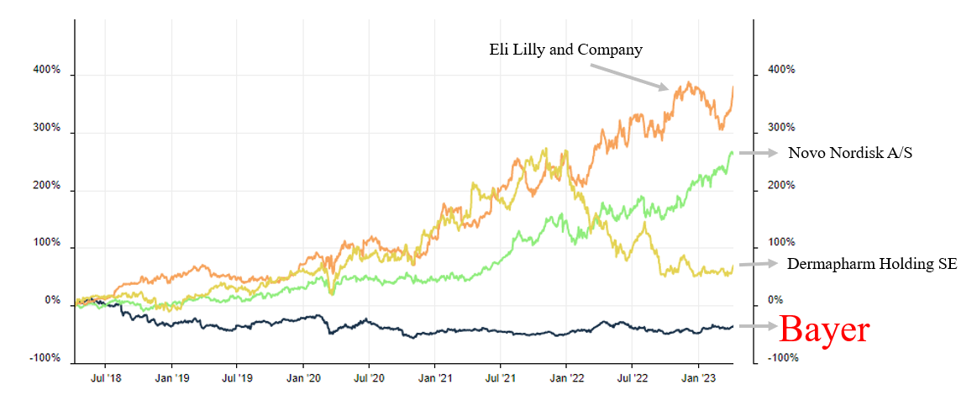
Some of the key competitors of Bayer AG in each of its business segments are:
Pharmaceuticals:
DowDuPont Inc.
Consumer Health:
Pharmaceuticals:
- Johnson & Johnson
- Pfizer Inc.
- Novartis International AG
- Merck & Co., Inc.
- GlaxoSmithKline plc
- Syngenta AG
- Corteva, Inc.
- BASF SE
DowDuPont Inc.
Consumer Health:
- Johnson & Johnson
- GlaxoSmithKline plc
- Procter & Gamble Co.
- Sanofi S.A.
- Reckitt Benckiser Group plc
Bayer AG - SWOT Analysis
Swot Analysis of BayerThe goal of SWOT analysis is to formulate a successful strategy for the future. Accordingly, the SWOT analysis of Bayer is carried out.
Strengths:Strong brand portfolio: Bayer AG owns and markets well-known brands in the pharmaceuticals, agriculture, and consumer health sectors, which provide a competitive advantage in the market. Diversified business segments: Bayer AG operates in multiple industries, including pharmaceuticals, agriculture, and consumer health, which diversifies its revenue streams and reduces dependency on a single market.
Research and development capabilities: Bayer AG has a strong focus on research and development (R&D), investing significantly in innovation to develop new products and technologies, which can lead to competitive advantages and market leadership. Global presence: Bayer AG has a global presence with operations in multiple countries, which provides access to diverse markets and customer bases.
Weaknesses:Litigation risks: Bayer AG has faced and continues to face legal challenges related to its acquisition of Monsanto and the alleged harmful effects of glyphosate-containing products, which could result in financial liabilities and reputational damage. Integration challenges: The acquisition of Monsanto has posed integration challenges for Bayer AG, including cultural differences, operational complexities, and regulatory hurdles. Dependence on key products: Bayer AG's revenue is dependent on a few key products, including Xarelto and Eylea, which exposes the company to risks associated with product concentration and potential loss of exclusivity.
Opportunities:Growth in emerging markets: Bayer AG has opportunities for growth in emerging markets, where rising population, urbanization, and increasing healthcare and agricultural needs present significant market potential. Expansion of digital solutions: Bayer AG can leverage digital technologies, such as data analytics, precision farming, and telemedicine, to develop and market innovative solutions for the pharmaceuticals and agriculture sectors. Focus on sustainability: The increasing demand for sustainable products and practices presents an opportunity for Bayer AG to develop and market environmentally friendly products and solutions, aligning with changing consumer preferences and regulatory trends.
Threats:Competitive landscape: Bayer AG faces intense competition from other global players in the pharmaceuticals, agriculture, and consumer health sectors, which could impact its market share, pricing, and profitability. Regulatory challenges: Bayer AG operates in highly regulated industries, and changes in regulations related to product approvals, pricing, labeling, and safety could pose challenges and impact its business operations. Economic and market risks: Bayer AG is exposed to risks associated with economic and market factors, such as currency fluctuations, inflation, trade policies, and geopolitical uncertainties, which could impact its financial performance and operations.
Bayer AG - Management
Average management tenure 5.1 years.
CEO – Wernwr Baumann (60 years young): have 13.3 years tenure, with a
compensation of €7,825,000
Mr. Werner Baumann has been Chairman of Management Board and Chief Executive Officer at Bayer AG since May 1, 2016 and has been its Member of Management Board since January 1, 2010. Since January 1, 2020, Mr. Baumann is a Chief Sustainability Officer of Bayer AG. He served as Labor Director at Bayer AG.
until January 31, 2021. Mr. Baumann served as Chief of Strategy & Portfolio Management - Europe / Middle East / Africa Region at Bayer AG. He served as the Chairman of Management Board and Chief Executive Officer of Bayer HealthCare AG from March 31, 2015 to December 2015. He served as the Chief Strategy & Portfolio Officer of Bayer AG from October 1, 2014 to May 1, 2016 and was responsible for the Europe, Middle East and Africa Region.
He served as Chief Financial Officer of Bayer AG from January 1, 2010 to October 1, 2014. He served as the President of Business Development & Licensing at Bayer HealthCare AG since March 1, 2006 and also served as its President of Central Administration & Organization from July 2002 to 2009. He joined Bayer AG in Leverkusen as a Commercial Trainee on April 1, 1966. Mr. Baumann served as a Member of Management Board at Bayer HealthCare AG since October 1, 2003 and served as its Labor Director.
As a member of the Board of Management and Labor Director of Bayer Schering Pharma AG, Berlin, Germany, from 2006 through September 2009, he actively participated in its integration into the former HealthCare subgroup. He served as Vice President of German Chemical Industry Association (VCI), Frankfurt. He served as President of German Chemical Industry Association from September 2005 to September 2007 and Vice President of Federation of German Industries (BDI), Berlin. He served as Head of Business Planning & Administration at Bayer HealthCare AG until 2002.
He joined Bayer AG in 1988 and served in Southwest Europe section of Corporate Finance Department. He served as Controller of Bayer Hispania Commercial in Barcelona, Spain since 1991 and also served as Assistant to Managing Director since 1995. He moved to Bayer Corporation in Tarrytown, New York, where he held various positions in Bayer's global Diagnostics Business Group. Since 1978, he served as Managing Director and administrative head of the Peruvian company.
Since April 1996, he served as Head of Corporate Planning and Controlling in Leverkusen. From 1970 to 1975, Mr. Baumann established and managed the finance and accounting department of Bayer Industrial S.A. He serves as Chairman of Supervisory Board at Bayer CropScience AG. He served as Chairman of Supervisory Board at Covestro AG until March 26, 2015.
He serves as a Member of Supervisory board of Henkel KGaA. He serves as a Member of the Advisory Council at Allianz Global Corporate & Specialty SE. Mr. Baumann served as a Member of Supervisory Board at Bayer Business Services GmbH. He studied Economics from RWTH Aachen Technical University and the University of Cologne.
WHO OWNS BAYER – OWNERSHIP STRUCTURE
Norges Bank Investment Management owns 27.5 million shares of Bayer AG, represents 2.8% of total shares outstanding, as of April 2023. Norges Bank investment, which manages the Government Pension Fund abroad on behalf of the Ministry of Finance. The value of the fund was NOK 14,372 billion in April 2023.
TOP SHAREHOLDERS
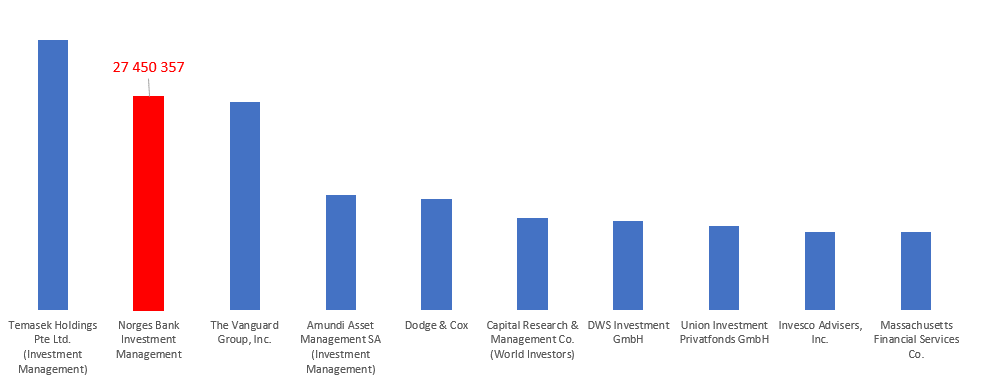
Business
Safaricom PLC is a leading telecommunication company in East Africa. It provides
In addition, it provides m-tiba, a health payment application; M Salama platform; FULIZA, an overdraft facility that allows customers to complete their transaction in case of insufficient funds; M-Shwari, a micro-lending/savings product; M-Kesho, an equity bank account; and Shupavu291, an education platform that enables students to study without an internet connection. The company serves individual, corporate, and SME customers, as well as government agencies. It sells its products and services through dealers and retail outlets. Safaricom PLC was incorporated in 1997 and is based in Nairobi, Kenya. As today Safaricom PLC serves over 42 million customers connected and play a critical role in the society, supporting over one million jobs both directly and indirectly while our total economic value was estimated at KES 362 Billion ($ 3.2 billion) for the 12 months through March 2021. They are listed on the Nairobi Securities Exchange (NSE) and with annual revenues of close to KES 298 Billion ($2.5 billion) as at March 2022.
- Voice, messaging, mobile data,
- and M-PESA payment, as well as
- Home fiber services.
- Mobile and fixed line services; and internet of things, and
- Cloud and hosting services.
In addition, it provides m-tiba, a health payment application; M Salama platform; FULIZA, an overdraft facility that allows customers to complete their transaction in case of insufficient funds; M-Shwari, a micro-lending/savings product; M-Kesho, an equity bank account; and Shupavu291, an education platform that enables students to study without an internet connection. The company serves individual, corporate, and SME customers, as well as government agencies. It sells its products and services through dealers and retail outlets. Safaricom PLC was incorporated in 1997 and is based in Nairobi, Kenya. As today Safaricom PLC serves over 42 million customers connected and play a critical role in the society, supporting over one million jobs both directly and indirectly while our total economic value was estimated at KES 362 Billion ($ 3.2 billion) for the 12 months through March 2021. They are listed on the Nairobi Securities Exchange (NSE) and with annual revenues of close to KES 298 Billion ($2.5 billion) as at March 2022.
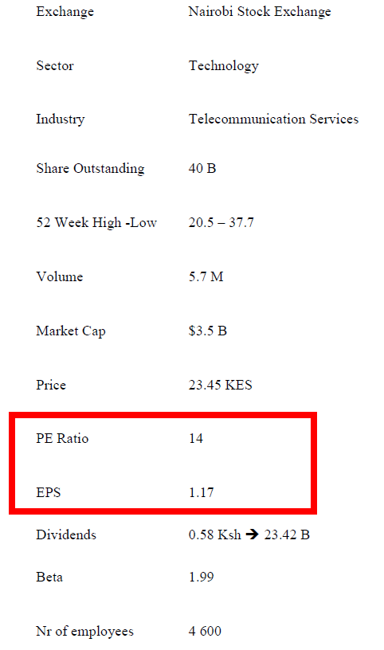
Safaricom Plc. Stock price fluctuations
Stock prices are driven by a variety of factors, but ultimately on the long-term horizon stock price are driven by earnings power and the managers ability to create values for every dollar that deployed. Current Safaricom's stock prices as 13 March 2023 are at the level of 2017 and 2019.
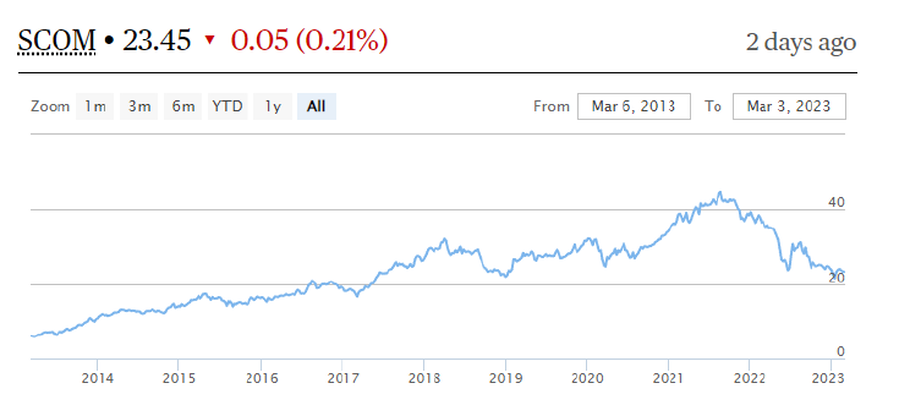
HOW DOES SAFARICOM Plc. MAKE MONEY ?
| Ten-years compound annual growth rate in revenue. The revenue CAGR for Safaricom (SCOM) stock is 19.88% for the period 2022. Compound annual growth rate (CAGR) is a commonly used business and investing term that measures the growth of a metric over multiple periods. | 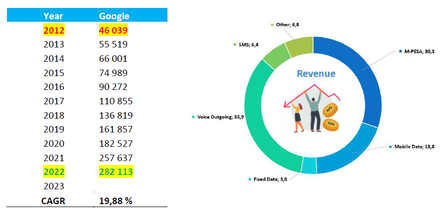 |
CAGRs are useful since they reduce the effect of volatility in specific periods, unlike arithmetic means. We can find the calculation details for Safaricom’s Revenue CAGR outlined below. The calculation starts by listing values for Revenue for the last ten fiscal years that are required to calculate CAGR:
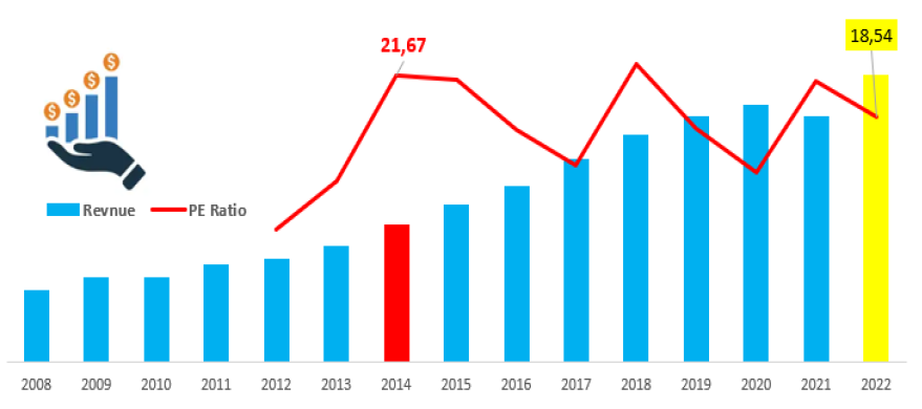
Price to Earnings Ratio vs Industry
Safaricom ~ Price-To-Earnings vs Peers: SCOM is good value based on its Price-To-Earnings Ratio 14x compared to the peer average 24.2x.
What do they offer ?
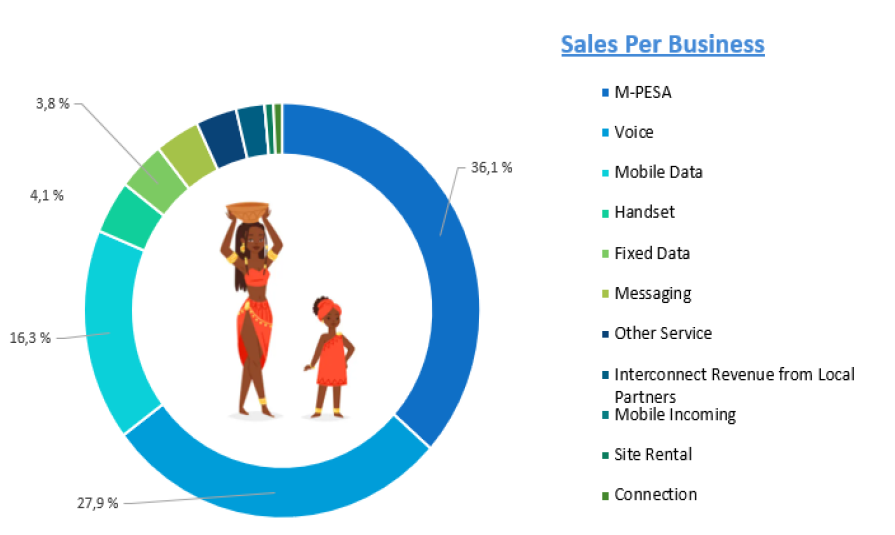
Competitors
The Kenya Telecom Market is expected to witness growth CAGR of 2.00% during the forecast period of 2021 to 2026, this is approximately a valuation of $3.5 billion. Most of the major telecom companies in Kenya, such as Safaricom, Airtel, and Telkom, are promote innovation by making significant R&D investments consistently. The Kenya’s telecommunication sector, which underpins the operations of all enterprises, public safety groups, and the government, is a crucial part of the country's economy.
The number of active mobile subscriptions as 31 March 2023 stood at 61.4 million, representing an increase of 2.6% from the preceding quarter. Subsequently, mobile (SIM) penetration grew,
by 3.3% points to stand at 129.1% during the period under review. During the same period, the data for Jamii Telecommunications Limited – a privately owned Kenyan telecommunication service provider offering broadband and mobile services under the "FAIBA" brand – is included in cellular mobile services sub-section which main services are delivering mobile data through 4G but also include Voice over LTE (VoLTE).
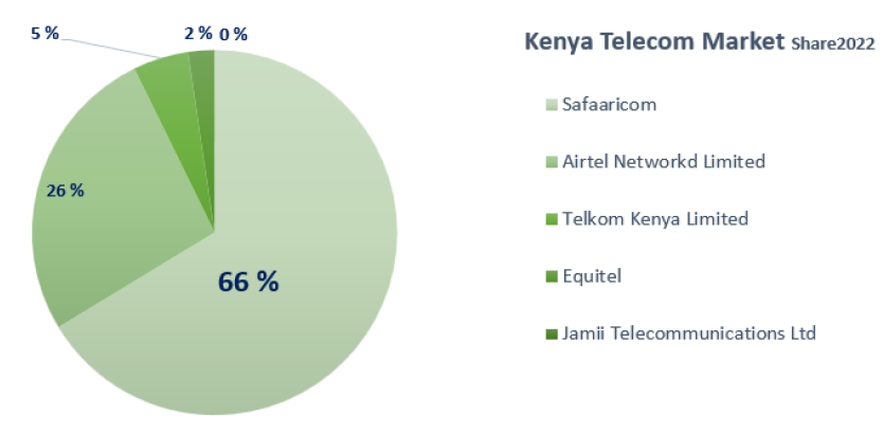
Financial Health
Safaricom celebrated the 15th anniversary of the introduction of M-PESA with various awareness campaigns. With its over 30 million monthly active customers, more than 3.2 million businesses, and over 42,000 developers engaged in ongoing development within the Super Apps, some 50 million transactions per day, and a velocity of funds exceeding KShs 2 trillion monthly, M-PESA truly constitutes a massive ecosystem whose potential is only just beginning to make itself felt.
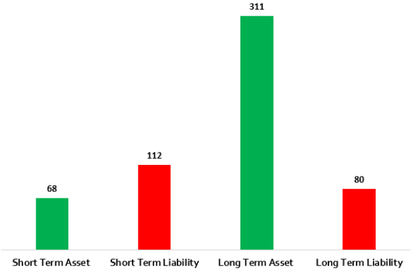 | Short term assets KES68.1B do not cover its short term liabilities KES112.2B. Short term assets (KES68.1B) do not cover its long term liabilities (KES80.4B). Net debt to equity ratio (36%) is considered satisfactory. Debt to equity ratio has increased from 6.9% to 44.5% over the past 5 years. Debt is well covered by operating cash flow (113.3%). Interest Coverage: SCOM's interest payments on its debt are well covered by EBIT (25.3x coverage). SCOM's dividend payments have been volatile in the past 10 years |
Management
Average management tenure 2.3 years.
CEO – Peter Nfegwa (53 years young): have 2.9 years tenure, with a compensation of KSH 288 930 000.
CEO – Peter Nfegwa (53 years young): have 2.9 years tenure, with a compensation of KSH 288 930 000.
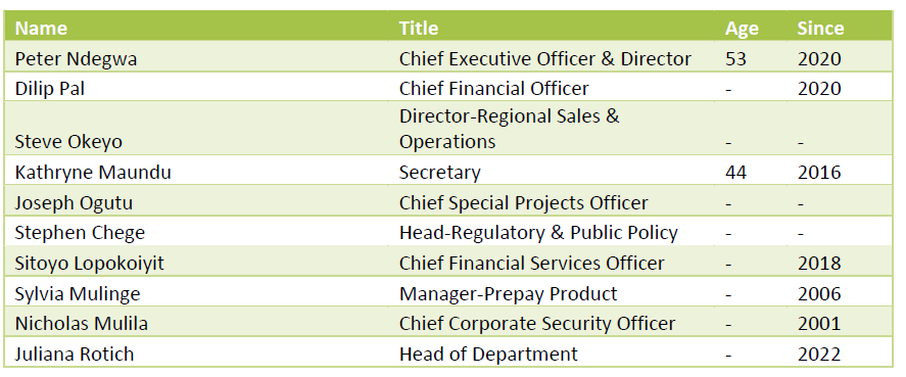
Mr. Peter Waititu Ndegwa has been Chief Executive Officer and Executive Director of Safaricom PLC since April 1, 2020. He serves as the Chief Executive Officer of Safaricom PLC. at Vodacom Group Limited since April 1, 2020. He served as the Chief Executive Officer and Managing Director of Guinness Nigeria Plc from September 4, 2015 until June 30, 2018.
Mr. Ndegwa served as Managing Director of Guinness Ghana Breweries Ltd. until July 20, 2015. Mr. Ndegwa served as Group Finance Director of East African Breweries Ltd., since August 28, 2008 and served as its Managing Director of Serengeti Breweries Limited. He was responsible for Diageo PLC operations in 50 countries in Western and Eastern Europe, Russia, Middle East and North Africa regions.
Mr. Ndegwa has experience in sales, Financial Services, General Management, Fast Moving Consumer Goods (FMCG), Business strategy, Finance Operations, business advisory and finance in a variety of sectors including retail, manufacturing, banking and insurance and general services. He joined EABL as Head of Group Strategy in January 2004 and Change Director Sales since March 2006, Head a radical change programme within the sales and commercial area. He served as EABL Sales Director of Kenya. He trained and worked with PricewaterhouseCoopers, in a variety of senior roles both in Eastern Africa and in the UK and served as an Associate Director in the Corporate Finance and Strategy practice.
He holds an MBA in Strategy and Finance from the London Business School and an Economics degree from the University of Nairobi. He is also a Certified Public Accountant.
Ownership
Safaricom were founded in 1997 as a fully owned subsidiary of Telkom Kenya before a 40 percent acquisition by Vodafone Group PLC in May 2000, and a public offering of 25 percent shares through the NSE in 2008.
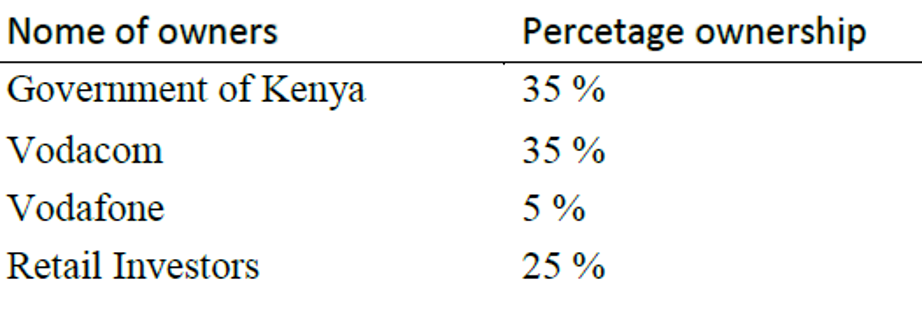
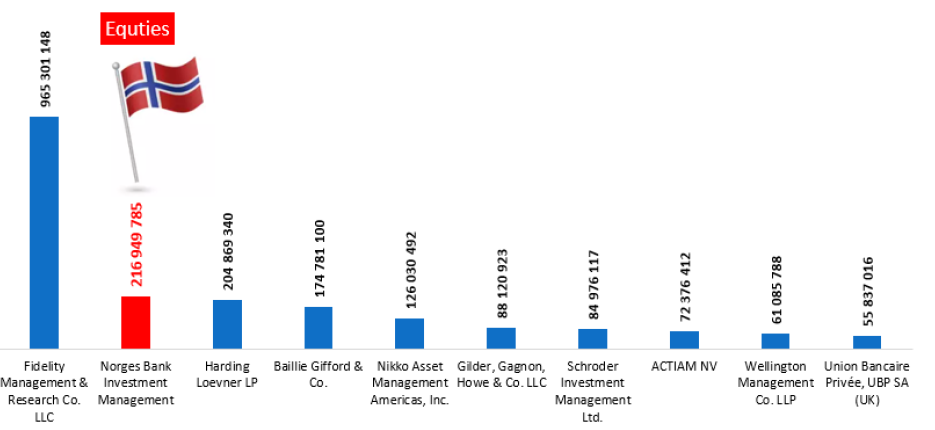
Distribution of shareholders
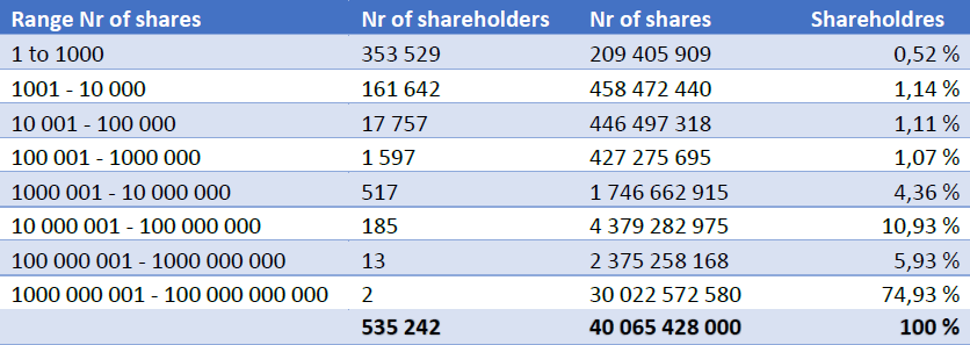
BUSINESS
Alphabet Inc. is a holding company which are organized around 6 areas of activities: the largest of which is Google. Google is divided in two segments, Google Services and Google Cloud; they also report all non-Google businesses collectively as Other Bets. YouTube provides people with entertainment, information, and opportunities to learn something new. And Google Assistant offers the best way to get things done seamlessly across different devices, providing intelligent help throughout a person's day, no matter where they are. To achieve their objective goal Google are continually innovating and building new product features that will help their users, partners, customers, and communities. Google have invested more than $100 billion in R&D over the last five years.
Other Bets also remain focused on innovation through technology that can positively affect people's lives. For instance, Waymo is working toward making transportation safer and easier for everyone and Verily is developing tools and platforms to improve health outcome. Nest Labs is develops and production of home automation solutions: Wi-Fi networks synchronized with the control programs for thermostats, smoke detectors and security systems; while Google X research into artificial intelligence.
Google Ventures an investment services: management of an investment fund devoted to young businesses that operate in the new technology sector and Goggle capital an investment fund intended for already developed companies. Google Fiber focuses on fiber optic internet access network infrastructure. The company was founded in 1998 and is headquartered in Mountain View, California.
BRANDS
Google’s intellectual property rights are valuable, and any inability to protect them could reduce the value of our products, services, and brands as well as affect our ability to compete.
KEY DATA
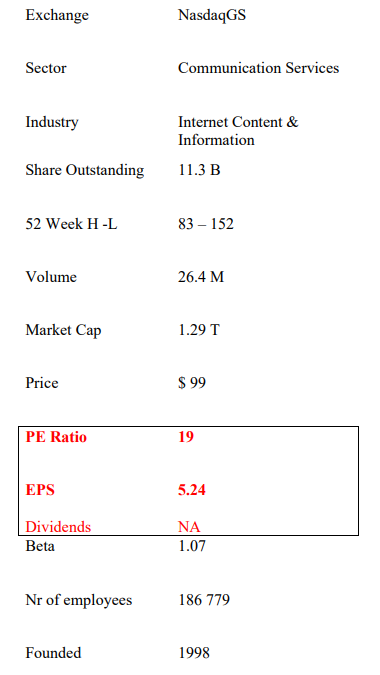
GOOG- STOCK PRICE FLUCTUATIONS [2017- SYS.DATE]
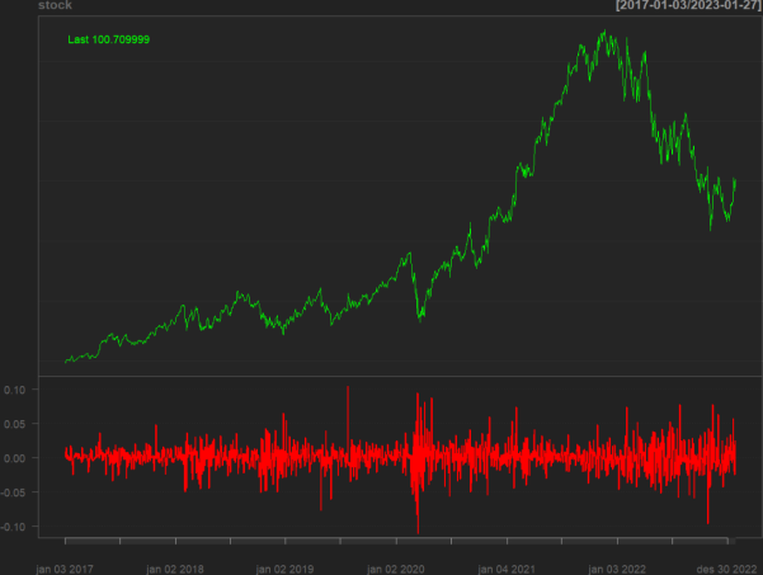
MONTHLY HISTORICAL STOCK PRICE
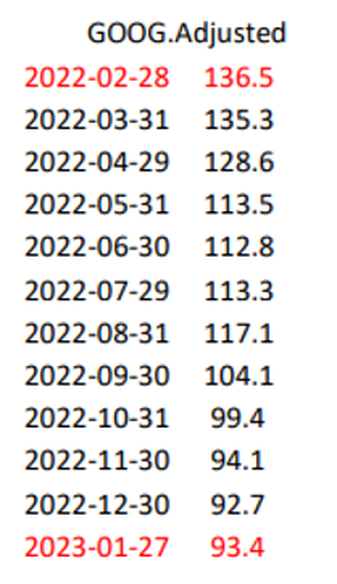
HOW WAS
THE LAST 1000 TRADING DAYS
OF GOOGLE'S STOCK PRICE DISTRIBUTION
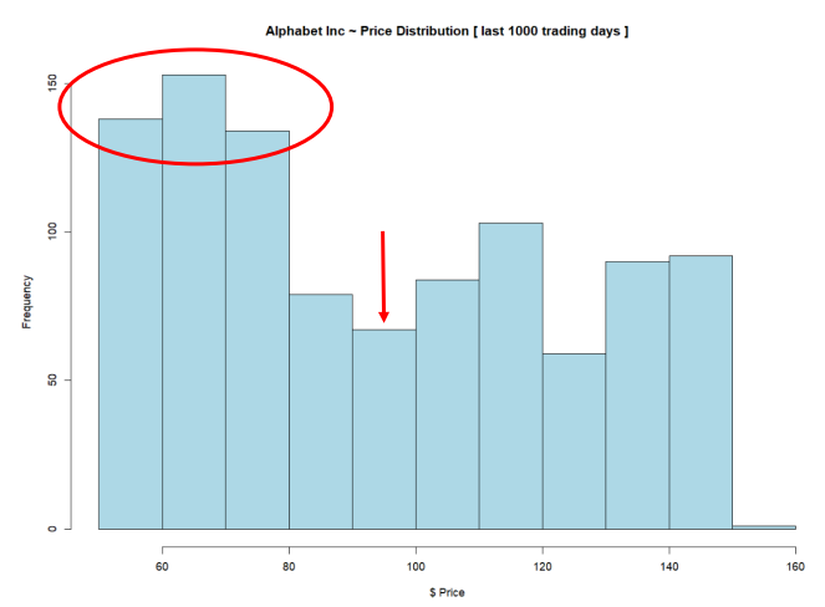
Currenly stock price as first February 2023 is at the red arrow, which is $99. Base of the histogram distrubution this price is at the second lowest price range since 2018. Most of the Googles stock price is distributed at a range of $60 to $70.
When I summurized is further, we observe as follows:
median Google's stock price at $112, which is 12 % greater than currently price.
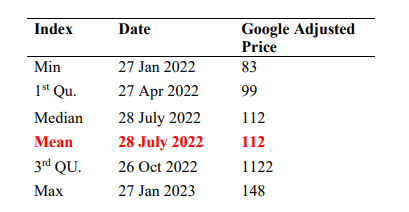
COMPARING STOCK PRICE FLUCTUATION
RED LINE SINCE: 2019- DECEMBER 2022
&
BLACK LINE SINCE JANUARY 2022
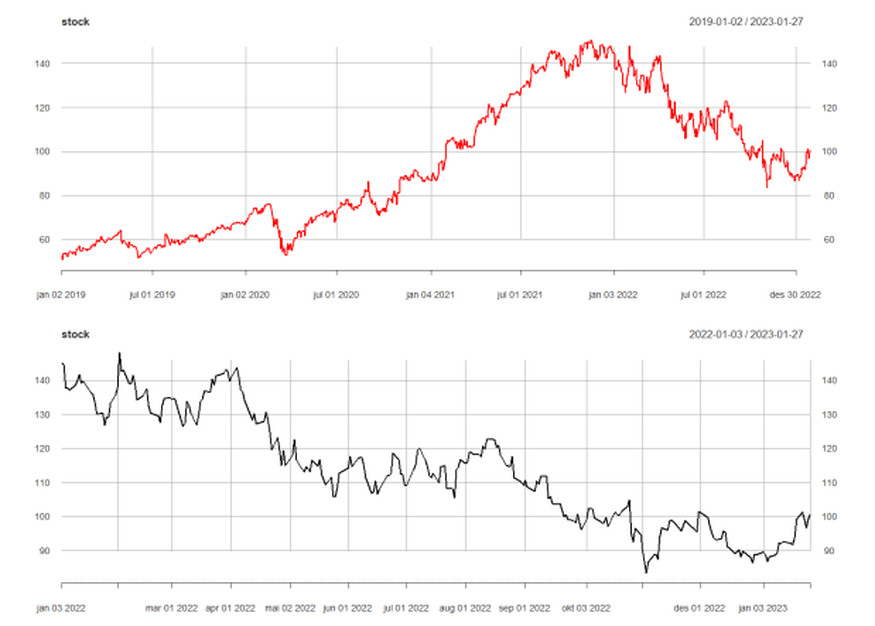
HOW WAS GOOGLE'S
MONTHLY
RETURN ON INVESTMENT (ROI)
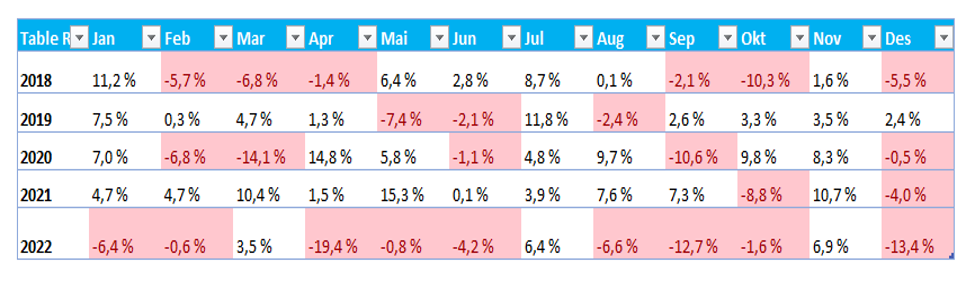
We notice that 2022 was the worst year for Google so does for technology sector as a whole.
HOW DOES GOOGLE MAKE MONEY ?
Google have built world-class advertising technologies for advertisers, agencies, and publishers to power their digital marketing businesses. Their advertising solutions help millions of companies grow their businesses through Google’s wide range of products across devices and formats, and they aim to ensure positive user experiences by serving the right ads at the right time and by building deep partnerships with brands and agencies.
Google Services generates revenues primarily by delivering both performance and brand advertising that appears on Google Search & other properties, YouTube and Google Network partners' properties ("Google Network properties"). This means in practice.
Google Services generates revenues primarily by delivering both performance and brand advertising that appears on Google Search & other properties, YouTube and Google Network partners' properties ("Google Network properties"). This means in practice.
- Performance advertising creates and delivers relevant ads that users will click on, leading to direct engagement with advertisers. Performance advertising lets their advertisers connect with users while driving measurable results. Google ads tools allow performance advertisers to create simple text-based ads.
- Brand advertising helps enhance users' awareness of and affinity for advertisers' products and services, through videos, text, images, and other interactive ads that run across various devices. They help brand advertisers deliver digital videos and other types of ads to specific audiences for their brand-building marketing campaigns.
- Google Cloud Google is a company built in the cloud. Google Cloud Platform generates revenues from infrastructure, platform, and other services.
- Google Workspace generates revenues from cloud-based collaboration tools for enterprises, such as Gmail, Docs, Drive, Calendar and Meet.
GOOGLE'S Historical Income Statement
Google’s compound annual average growth rate since 2012 is astonishing of 19.9 %. Continuously present in the international market operations are growing significant to Google’s revenues and net income. International revenues accounted for approximately 54% of our consolidated revenues in 2021.
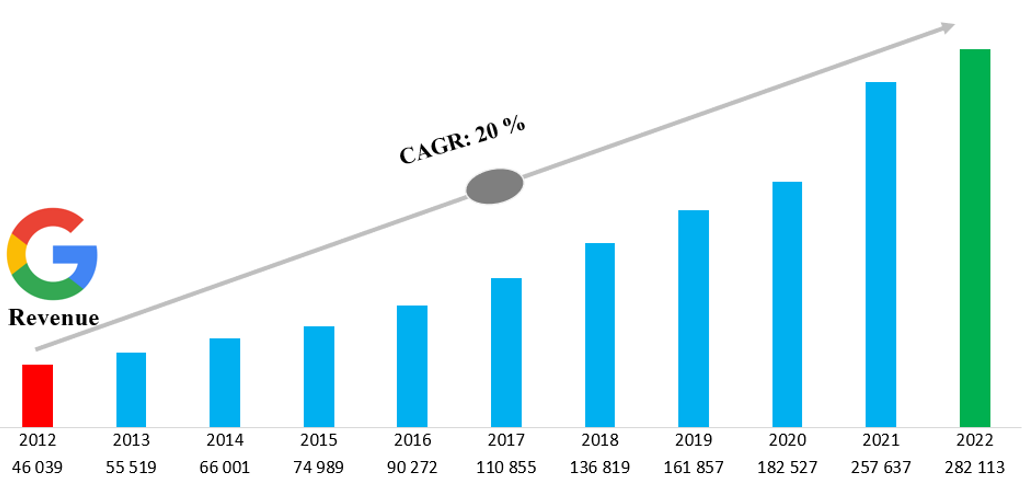
SOURCES OF REVENUES:
BREAKING DOWN SALES PER BUSINESS
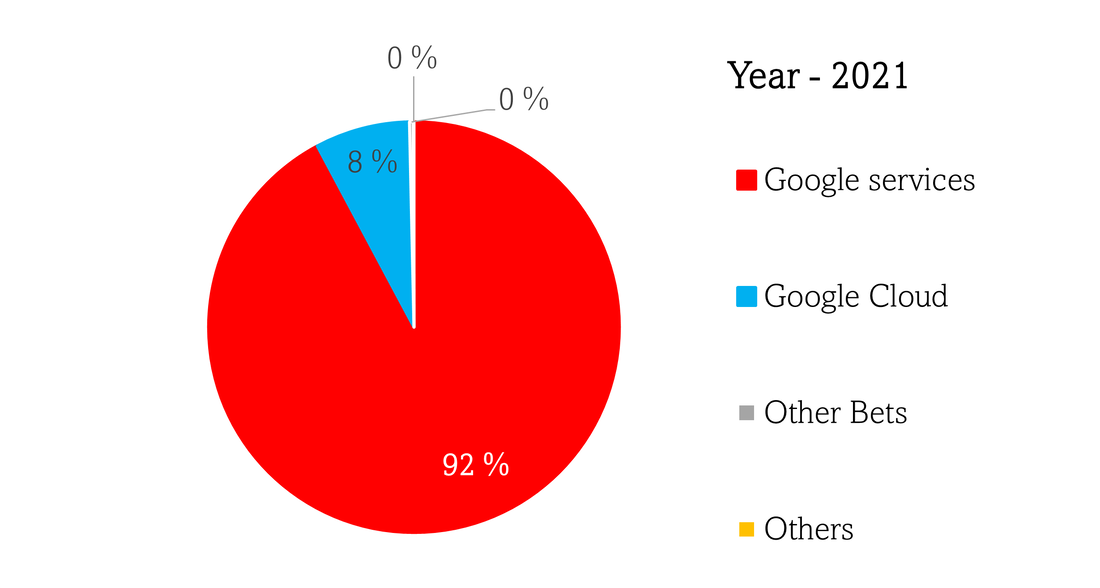
the most important revenue provider. Google services operating income increased $37.2 billion from 2020 to 2021. The increase was due to growth in revenues partially offset by increases in TAC, content acquisition costs, compensation expenses, advertising and promotional expenses, and charges related to certain legal matters.
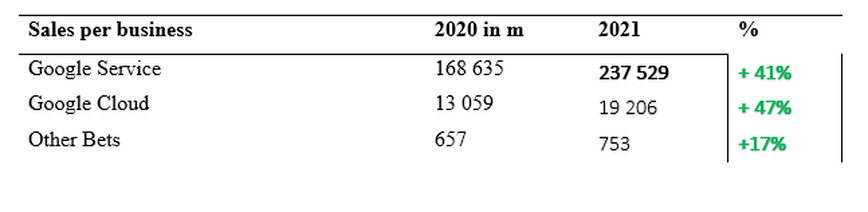
FROM WHICH PART OF THE WORLD
DOES GOOGLE GENERATE IT'S REVENUE ?
Net sales are distributed geographically as follows: the United States (45.8%), Americas (5.6%), Europe/Middle East/Africa (30.7%) and Asia/Pacific (17.9%).
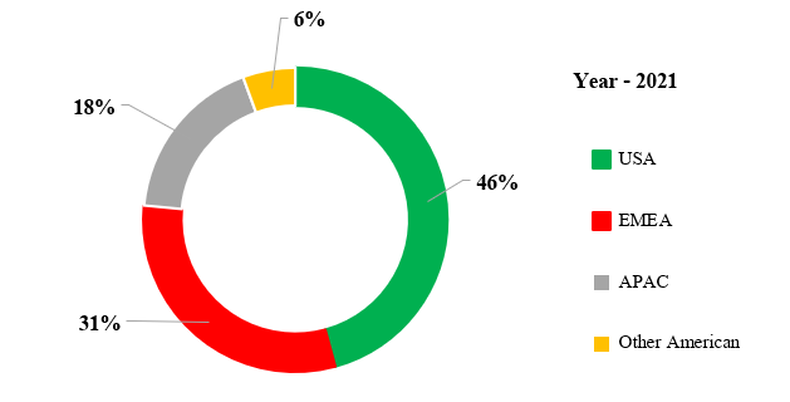
GOOGLE'S COMPETITORS
Google business is characterized by rapid change as well as new and disruptive technologies. They face formidable competition in every aspect of their business, including from:
General purpose search engines and information services, such as Baidu, Microsoft's Bing, Naver, Seznam, Yahoo, and Yandex.
Vertical search engines and e-commerce providers, such as Amazon and eBay (e-commerce), Booking's Kayak (travel queries), Microsoft's LinkedIn (job queries), and WebMD (health queries). Some users will navigate directly to such content, websites, and apps rather than go through Google.
Social networks offered by ByteDance, Meta, Snap, and Twitter. Some users increasingly rely on social networks for product or service referrals, rather than seeking information through traditional search engines. Other online advertising platforms and networks, such as Amazon, AppNexus, Criteo, and Meta, that compete for advertisers that use Google Ads, our primary auction-based advertising platform.
Other forms of advertising, such as billboards, magazines, newspapers, radio, and television. Their advertisers typically advertise in multiple media, both online and offline. Companies that design, manufacture, and market consumer hardware products, including businesses that have developed proprietary platforms, such as Amazon, Apple, and Microsoft. Digital assistant providers, such as Amazon and Apple.
Providers of enterprise cloud services, such as Alibaba, Amazon, Microsoft, and Salesforce.
Providers of digital video services, such as Amazon, Apple, AT&T, ByteDance, Disney, Hulu, Meta, and Netflix. Other digital content and application platform providers, such as Amazon and Apple. Providers of workspace connectivity and productivity products, such as Meta, Microsoft, Salesforce, and Zoom.
Competing successfully depends heavily on their ability to develop and distribute innovative products and technologies to the marketplace across our businesses. Specifically, for advertising, competing successfully depends on attracting and retaining: users, for whom other products and services are literally one click away, largely on the basis of the relevance of our advertising, as well as the general usefulness, security, and availability of our products and services; advertisers, primarily based on our ability to generate sales leads, and ultimately customers, and to deliver their advertisements in an efficient and effective manner across a variety of distribution channels; and content providers, primarily based on the quality of our advertiser base, our ability to help these partners generate revenues from advertising, and the terms of our agreements with them.
GOOGLE'S SWOT ANALYSIS
Google’s TreatsGoogle might had enjoyed the dominance of search engine marketplace for quite some time, however lately trend from TikTok, I don’t search I TikTok is taking gradually more of Google’s marketplace. As date Google has market share of +80% in desktop searches worldwide. Google’s next competitor Bing is working to integrate ChatGPT with its search engine, that is supported by OpenID to power Bing, this might be the start of the real Google’s challenge.
Google’s OpportunitiesThe shift to online, as well as the advent of the multi-device world, has brought opportunities outside of the U.S., including in emerging markets, such as India. Google are continue to invest heavily and develop localized versions of our products and advertising programs relevant to their users in these markets. This has led to a trend of increased revenues from emerging markets. Google expect that their results will continue to be affected by their performance in these markets, particularly as low-cost mobile devices become more available. This trend could affect our revenues as developing markets initially monetize at a lower rate than more mature markets.
Every year, there are trillions of searches on Google, and 15% of the searches we see every day are new. Google continue to invest deeply in AI and other technologies to ensure the most helpful search experience possible. YouTube provides people with entertainment, information, and opportunities to learn something new. And Google Assistant offers the best way to get things done seamlessly across different devices, providing intelligent help throughout a person's day, no matter where they are.
To diversify its revenue stream, Google is placing big bets on its cloud services. Cloud Services: In fiscal year 2021, about 7.5% ($19.2 Billion) of Google’s annual revenue came from its Google Cloud Platform (GCP) and its service.
Google’s weaknessIn 2021 Google generated more than 80% of total revenues from the display of ads online. Heavily overdependence on Advertisement: 80% of its total revenue generates from its advertisement related. Advertisement space is highly cyclical, competitive, and rely heavily on macroeconomic conditions. Inflation is 40 years high, this might affect consumers’ confidence and hurt Google’s revenue.
Unfair Business Practices: As the most used search engine, Google exploits this advantage unfairly to prevent the entry new actors in the sector. Politicians are keep monitoring Google’s privacy practice.
HOW HEALTHY IS GOOGLE'S FINANCIAL SITUATION ?
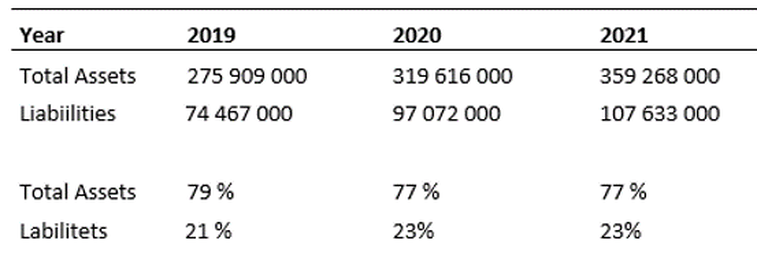
Assets and liabilities recorded at fair value are measured and classified in accordance with a three-tier fair value hierarchy based on the observability of the inputs available in the market used to measure fair value.
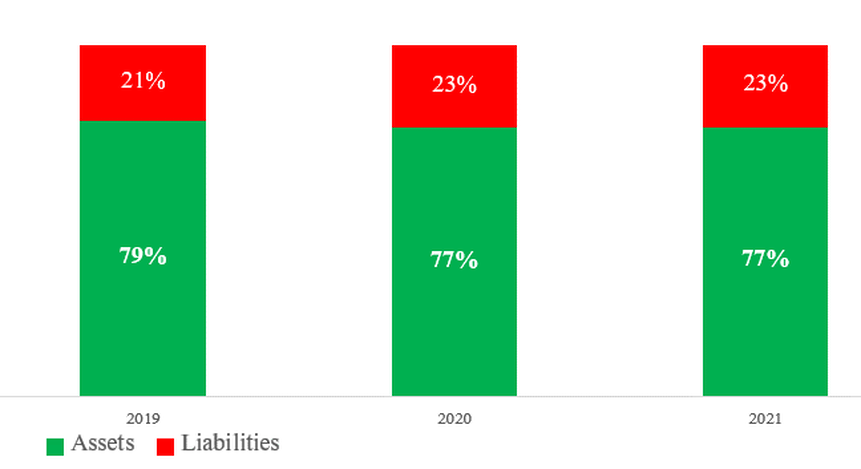
RISK FACORS FACING GOOGLE
Google’s operations and financial results are subject to various risks and uncertainties, including but not limited to those described below, which could harm our business, reputation, financial condition, and operating results, and affect the trading price of our Class A and Class C stock.
GOOGLE'S RISK SPECIFIC
They generate a significant portion of their revenues from advertising, and reduced spending by advertisers, a loss of partners, or new and existing technologies that block ads online and/or affect our ability to customize ads could harm our business.
As date Google generated more than 80% of total revenues from the display of ads online in 2021. Many of their advertisers, companies that distribute our products and services, digital publishers, and content providers can terminate their contracts with us at any time. These partners may not continue to do business with us if we do not create more value (such as increased numbers of users or customers, new sales leads, increased brand awareness, or more effective monetization) than their available alternatives. Changes to their advertising policies and data privacy practices, as well as changes to other companies’ advertising and/or data privacy practices have in the past, and may in the future, affect the advertising that we are able to provide, which could harm our business. In addition, technologies have been developed that make customized ads more difficult or that block the display of ads altogether and some providers of online services have integrated technologies that could potentially impair the availability and functionality of third-party digital advertising.
In addition, expenditures by advertisers tend to be cyclical, reflecting overall economic conditions and budgeting and buying patterns. Adverse macroeconomic conditions have affected, and may in the future affect, the demand for advertising, resulting in fluctuations in the amounts our advertisers spend on advertising, which could harm our financial condition and operating results.
R & D
R&D is a vital post for technology companies. Google are continually innovating and building new product features that will help users, partners, customers, and communities. They have invested more than $100 billion in R&D over the last five years. Google’s R&D expenses increased $4.0 billion from 2020 to 2021. The increase was primarily due to an increase in compensation expenses of $3.5 billion, largely resulting from an 11% increase in headcount, and an increase in professional service fees of $516 million. This increase was partially offset by a reduction in depreciation expense of $450 million including the effect of our change in the estimated useful life of their servers and certain network equipment.
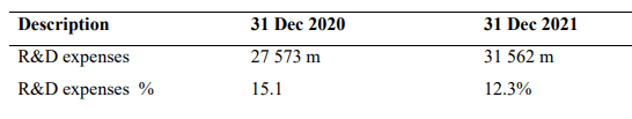
BEHIND THE SCEEN OF GOOGLE - MANAGEMENT'S
Sundar Pichai(49Y)
6.1-years average management tenure
$ 6,322,599 compensation
Mr. Sundar Pichai is Chief Executive Officer at Alphabet Inc. since December 2019. Mr. Pichai has been the Chief Executive Officer of Google Inc., since October 02, 2015. Mr. Pichai leads the product management and innovation efforts for a suite of Google's search and consumer products, including iGoogle, Google Toolbar, Desktop Search and Gadgets, Google Pack and Gears.
He has experience developing high-tech consumer and enterprise products. Mr. Pichai served as Senior Vice President of Products at Google Inc. (currently known as Alphabet Inc.) from October 2014 to October 2, 2015. He served as Senior Vice President of Android, Chrome & Apps at Google Inc. from March 2013 to October 2014. Mr. Pichai served as the Head of Android Mobile Software Division at Google Inc. since March 2013.
He served as the Head of the Chrome Browser & Computer Operating System at Google Inc. He served as Senior Vice President of Chrome at Google Inc. from April 2011 to March 2013. He served as Vice President of Product Management at Google Inc. He joined Google in 2004. Prior to Google, he served various engineering and product management positions at Applied Materials and served as Management Consultant of McKinsey & Company, Inc. for a variety of software and semiconductor clients. He has been a Director of Alphabet Inc. since July 19, 2017.
He served as a Director of Jive Software, Inc. from March 2011 to July 30, 2013. He served as a Member of Board of Advisors at Ruba, Inc. He was awarded an Institute Silver Medal. He was named a Siebel Scholar and a Palmer Scholar at the Wharton School. Mr. Pichai received Bachelor of Engineering degree with honors in metallurgical engineering from the Indian Institute of Technology, Kharagpur.
He holds an M.S. in Engineering and Materials Science from Stanford University and an MBA from the Wharton School of the University of Pennsylvania
WHO OWNS GOOGLE- OWNERSHIP STRUCTURE
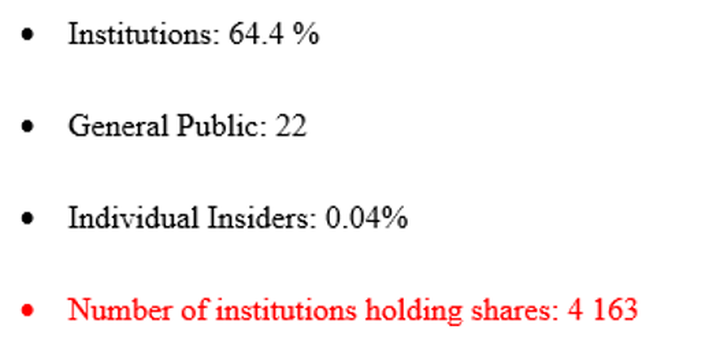
TOP SHAREHOLDERS
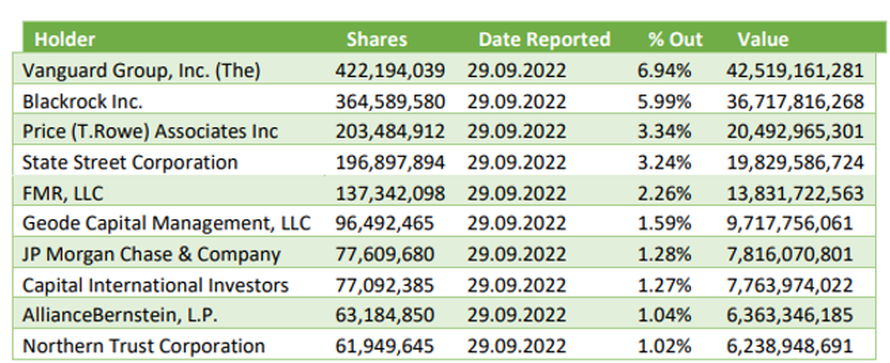
BusinessVolvo Car AB is a Sweden-based automotive brand. Volvo Car Group is focused on the design, engineering, manufacturing, distribution, and sale of passenger cars, with particular focus on sustainability, fully electric cars, and direct consumer relations, including subscription and other new mobility services. Volvo Car Group addressable market is the global premium passenger car market. Moreover, the Company intention is to be a pure electric car company and as a result it is undergoing a shift in its business model to a direct sales model in most of its markets. Volvo Cars commitment to electrification also results in the launch of Polestar, a progressive stand-alone electric performance car brand, in which Volvo Cars owns shares. Volvo Cars also holds shares in the automotive brand LYNK&CO, which focuses on young open-minded urban people through a flexible customer offering.
Brands

Volvo Cars is a small producer, with a global market share of 1–2 percent. The largest market, China, represented some 23 per cent of the total sales volume in 2022, followed by Europe (21%), the US (18%), other markets(11%), Sweden(6%), the UK (5.5%), and Germany (6%).
 |  |
Key Data - of VolvoCar stock
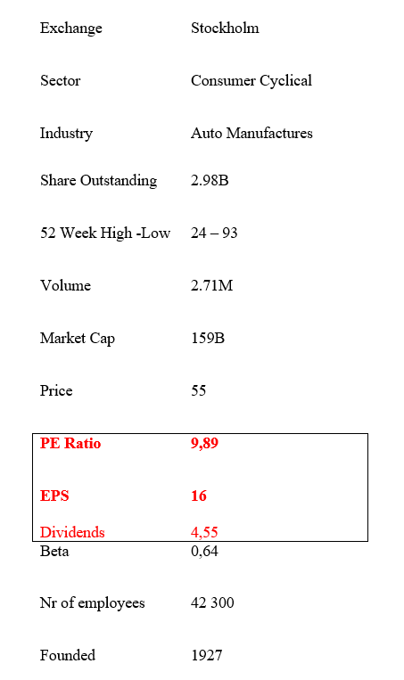
The following tables provide a summary of
VolvoCar Income Statements
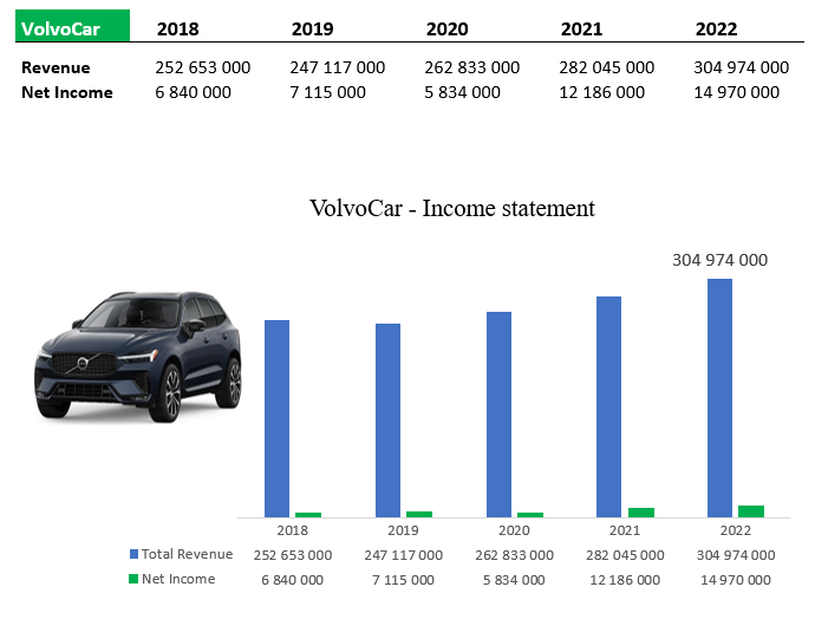
Sources of VolvoCar revenues
Unit cars sold annually is descending since top Q4 2022. One way to protect revenue is selling at higher price than of year 2020.
Unit cars sold annually is descending since top Q4 2022. One way to protect revenue is selling at higher price than of year 2020.
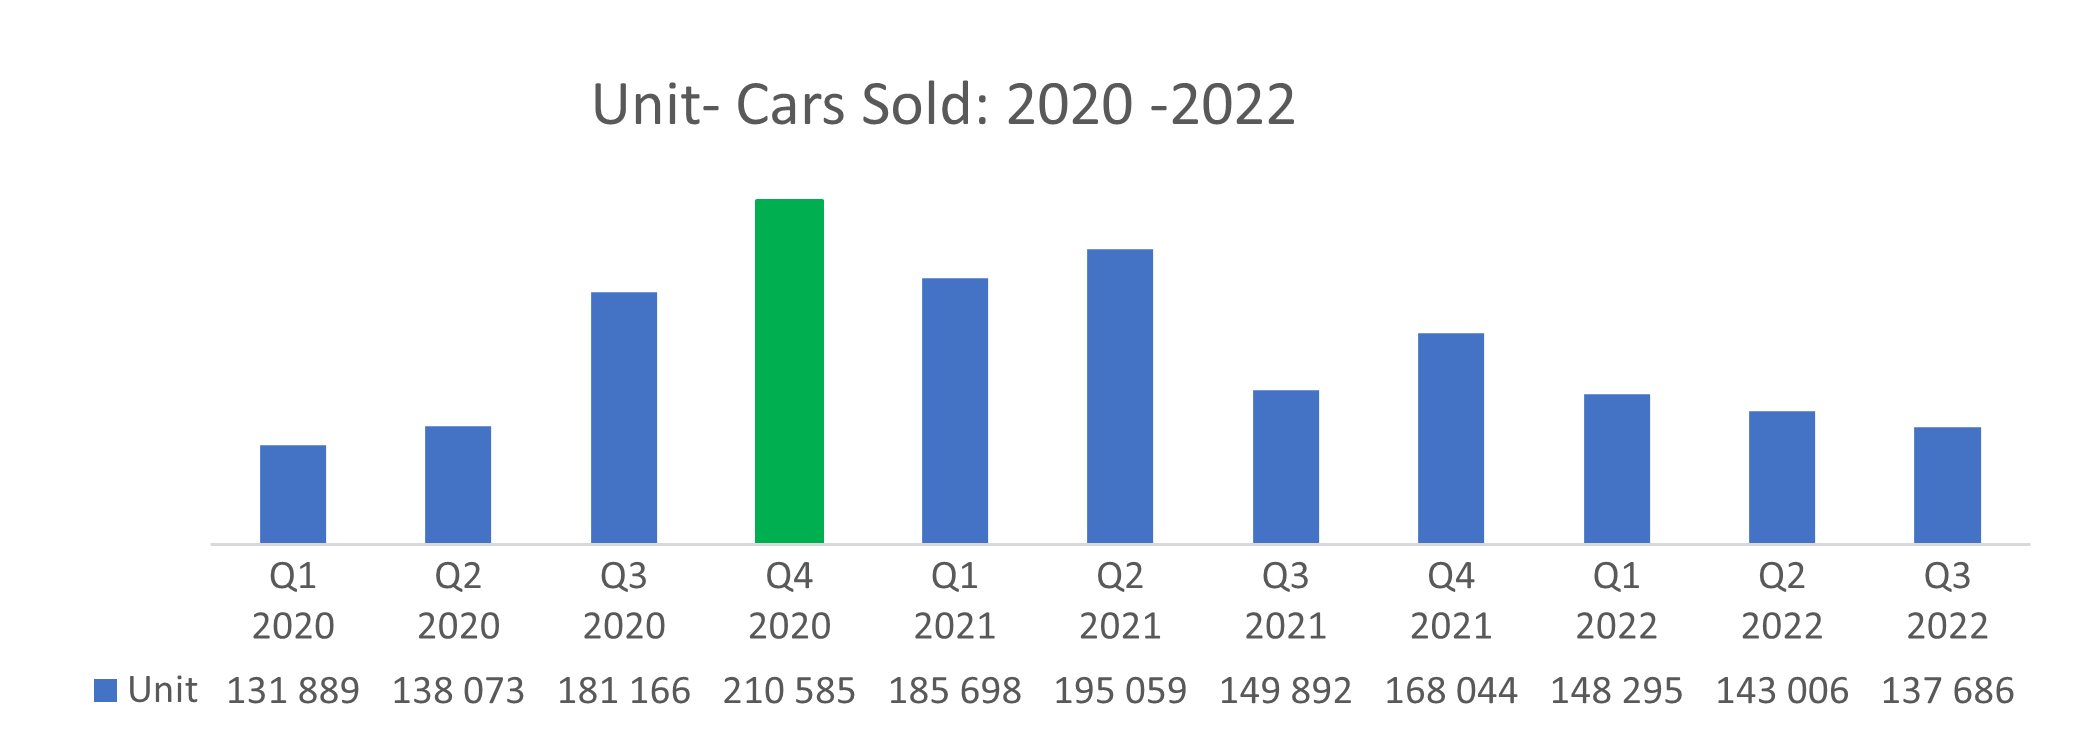
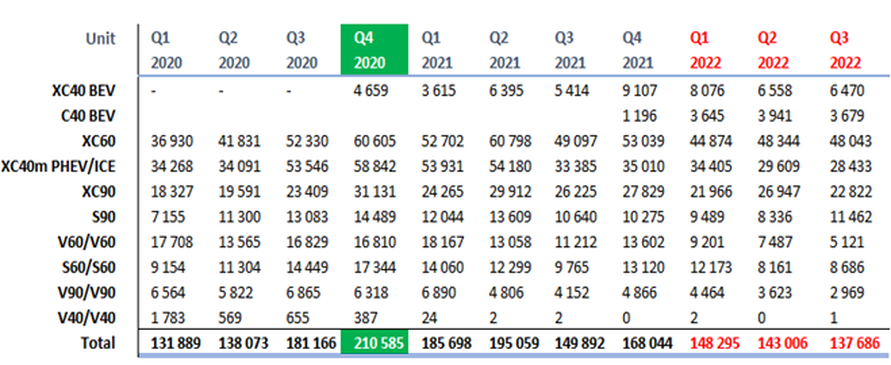
What do they offer ?
We can see clearly that automotive branch generates the greatest revenue in total 89% of the 2021 revenues, while used cars business covers 7%.
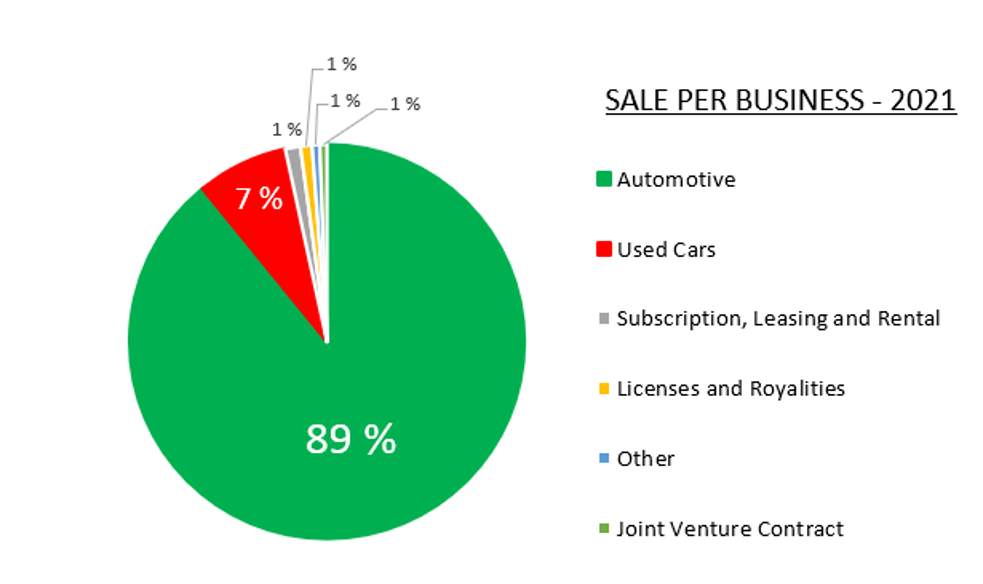
Sales per region
Sales per region is well diversified. This provides a protection against a sharp macroeconomic decline.
R & D
One of the most significant and noticeable aspects that distinguish modern cars even from their 10-year-old predecessors is the number of software-controlled options. As we all know, describing the Volvo brand in one word is simply: safety. Therefore, role of software has kept providing Volvo brand to live up to its brand. This means not only quality-of-life improvements for the drivers but also that the manufacturers need to come up with new innovative solutions to compete. Latest engineered performance seen in VolvoCar is a result of the constant investment and tireless innovation of their R&D team. We know R&D section plays a significant role for modern automotive in order to succeed. The cost of R&D for VolvoCar is as follows.
Since 2012 VolvoCar R&R expense on average was -4.9% of its revenue. This means Volvo have managed to keep R&D costs low while improving its digital technology.
VolvoCar
Historical
Stock Price
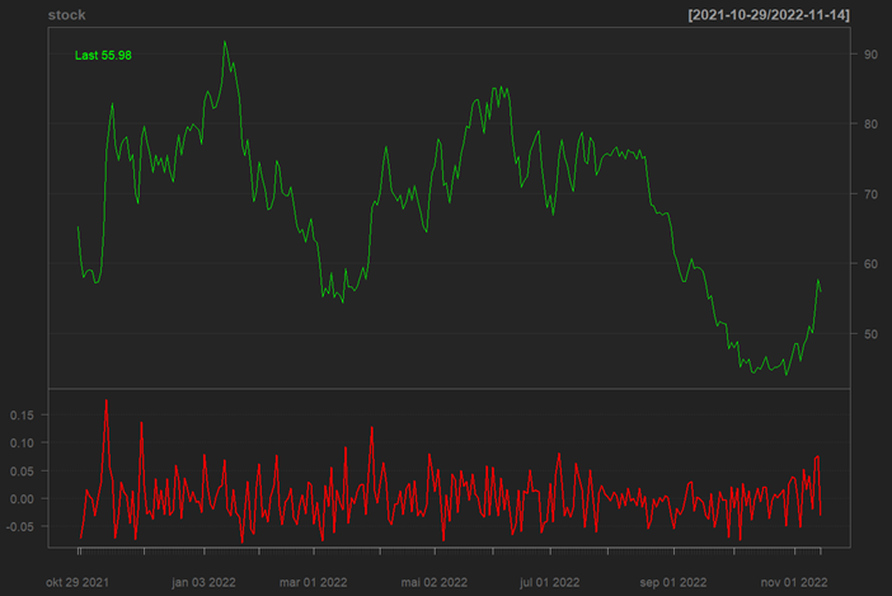
Monthly VolvoCar stock
price fluctuations
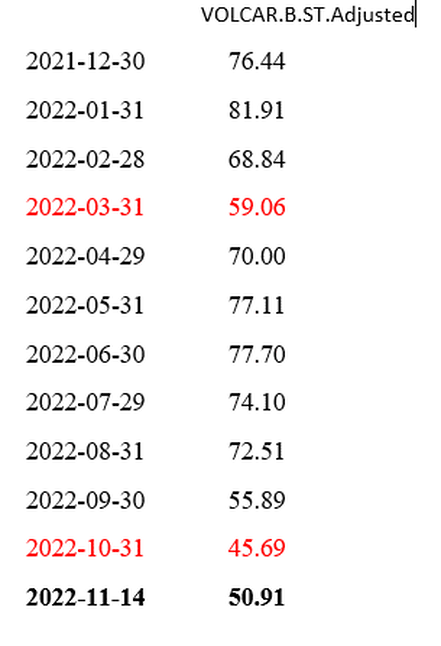
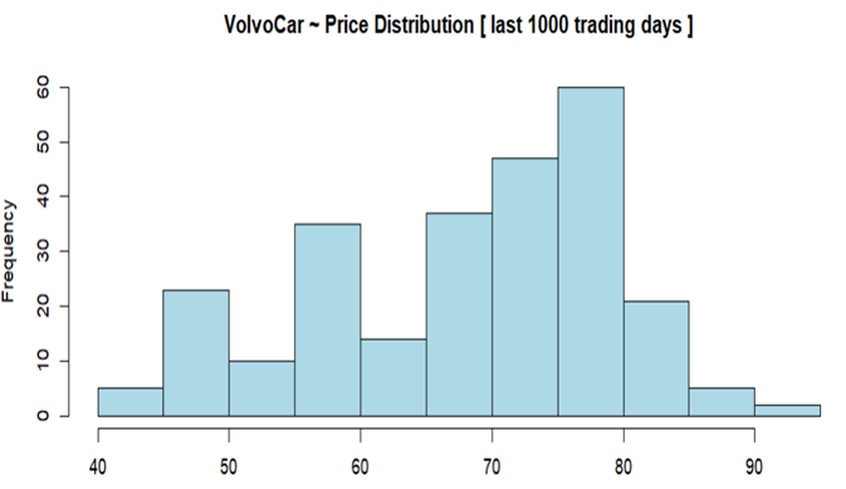
Valuation
Let’s see if VOLCAR is undervalued compared to its fair value, analyst forecasts and its price relative to the market? Base of PE Ratio VolvoCar is good value 11x compared to the peer average as date November 2022. However, VolvoCar is slightly expensive compare to the Global auto industry average.
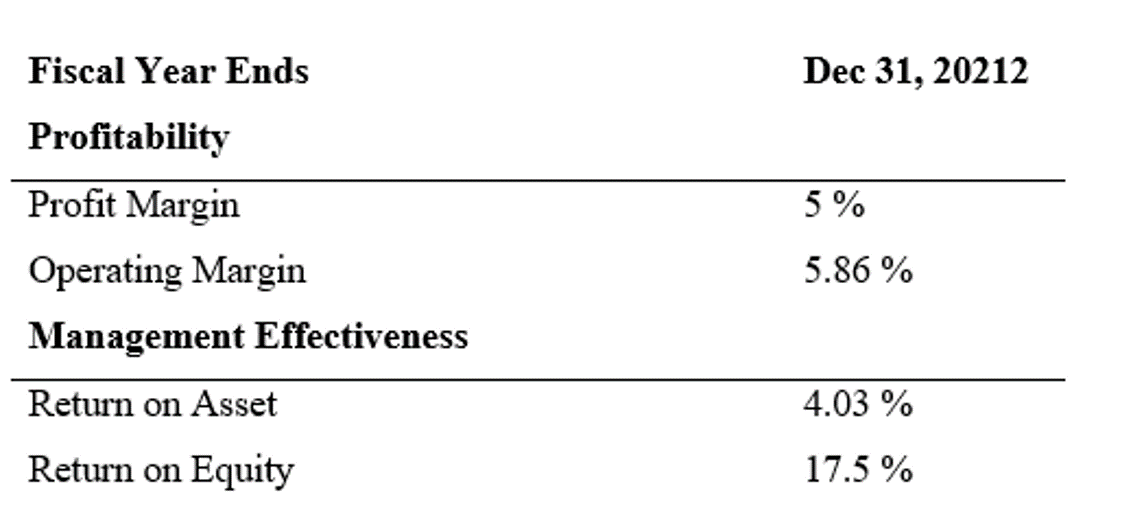
SWOT ANALYSIS
Reading the swot analysis of Volvo, we will understand what are the critical factors which are responsible for the success of this firm and factors which can be dynamic and game-changing in the future.
Strength of VolvoCar
VolvoCar has strong market position – they are the market leader for most of its segments. Volvo has a strong position throughout the world due to its continuous expansion and use of modern technology. Strong R&D team provides them an edge over competitors’ products, and it helps them to stay in the race and innovate. At the same time what matters for customers is safety, reliable brand – Volvo is one of the most reliable and trusted brands in the world. They have a reputation for making the world’s safest cars for several decades. Having a successful and strong market presence also what helps a company like Volvo be recognized in the industry.
Weaknesses of VolvoCar,
Weaknesses are internal factors that place the company at a disadvantage compared to its competitors. As most auto manufacturing, in 2019 Volvo to recall 460,769 cars worldwide over air bag rupture fatality. Lately in 2022 Volvo's plug-in hybrid XC60 and XC90 have been recalled to fix a problem with the engine control module, although owners won't need to visit a dealer for a fix. If problems continue to rise thus can affected the brand image of VolvoCar and can has create a bad impact on the brand name of VolvoCar going forward.
Opportunities for VolvoCar
Opportunities are external factors that the company can potentially benefit from when recognized. It is not surprising that electric cars are the future of the automation industry. After huge demand for Tesla cars and the public’s concern towards sustainability become a huge opportunity for electric vehicles. Volvo has already set a goal to end fuel vehicle with in 2030. Therefore, Volvo Cars commitment to electrification also results in the launch of Polestar, a progressive stand-alone electric performance car brand, in which Volvo Cars owns shares. Volvo Cars also holds shares in the automotive brand LYNK&CO, which focuses on young open-minded urban people through a flexible customer offering.
Treats to VolvoCar
Threats are external factors that a company should be aware of to hold its status in the market. Threats to Volvo – Price wars – Internal competition with competitors causes price wars. Volvo faces tough competition in all its segments which forces them to do product competition i.e., fighting for giving a better quality of product or service. Currency fluctuations – Volvo operates globally in so many countries and hence it receives many kinds of currencies. All currencies are not stable, and some are unacceptable due to fluctuations happening in their value. Volvo accepts Swedish Konner and US dollars create fluctuations in their total value.
Competitors of Volvo
Following are the major competitors of VolvoCar
- BMW -X3
- Mercedes-Benz
- Land Rover – Discovery Sport
- Hyundai Santa Fe
- Tesla
- NIO
- Audi Q5
- Lexus NX
VolvoCar - FINANCIAL HEALTH
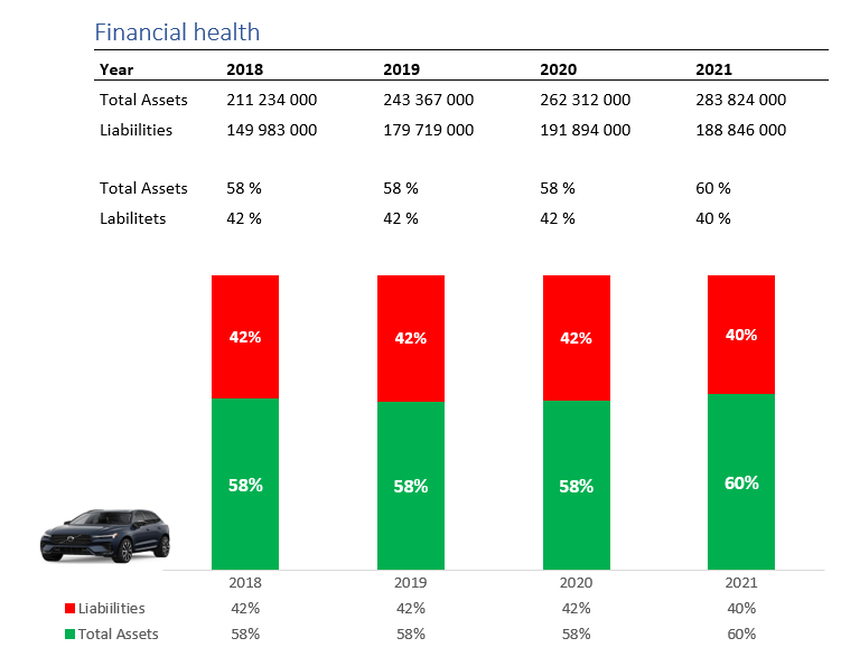
Management
ManagementJim Rowan(57Y)
0.5-year tenure
$NA salary
VOLCAR B's management team is not considered experienced ( 0.5 years average tenure), which suggests a new team. However, VOLCAR B's board of directors are considered experienced (7.8 years average tenure).
Mr. James Rowan, also known as Jim, is a Director of Polestar Automotive Holding UK PLC from June 2022. He serves as CEO & President at McDonald Hopkins, LLC since March 21, 2022. He serves as Director of Volvo Car AB (publ.) since May 11, 2022 and serves as its Chief Executive Officer and President.
He serves as Director of PCH International since August 26, 2020. He serves as Chief Executive Officer of Consumer & Healthcare Division and Director at Ember Technologies, Inc. since February 16, 2021. He serves as Senior Advisor at KKR & Co. Inc. since November 2020. He served as Lead Independent Director at Nanofilm Technologies International Limited. He served as the Chief Operating Officer of Global Manufacturing & Supply Chain at BlackBerry Limited (aka Research in Motion Limited) from July 2011 to March 2012. He served as Senior Vice President of Global Manufacturing & Supply Chain at Research In Motion Limited. He served as an Executive Vice President of Worldwide Operations for Celestica. Prior to that, he was based in Vienna, Austria where he worked for Flextronics as the Vice President of Operations for their European Region and a senior executive at Flextronics. He was also a Founder of two start-ups which were extremely successful. He serves as a Member of Executive Advisory Board at SCM World Limited. He brings global experience in the consumer and technology sectors. He led Dyson as its CEO between 2017 and 2020, during which time he accelerated the company’s e-commerce strategy and significantly grew its market share worldwide.
Weybourne Services Singapore Pte. Ltd. Dyson Appliances (Aust.) Pty Limited Dyson B2B, Inc Dyson B2B Technical Services Inc Dyson Canada Limited Dyson Direct, Inc Dyson Hong Kong Limited Dyson K.K. Dyson Manufacturing Sdn.
Bhd. Dyson New Zealand Limited Dyson Technical Services, Inc. Dyson Technology Inc Dyson, Inc. Sakti3, Inc. Dyson SAS Dyson Research and Development (Shanghai) Limited Dyson Technology (Beijing) Ltd Dyson Technology (Shanghai) Limited. He a Dictatorship in Momentum Technologies Pte Ltd PCH International Limited. He is an Advisory Board Member of Nanyang Technological University’s School of Mechanical & Aerospace Engineering.
He was Non-Executive Non-Independent Director at Nanofilm Technologies International Limited since May 14, 2021 until March 01, 2022. He works as advisor at Sydrogen Energy Pte. Ltd. (Sydrogen).
Ownership Structure
- Institutions: 37.3 %
- General Public: 4.3
- Individual Insiders: 0.5%
- Private Companies: 84%
Top Institutional Holders
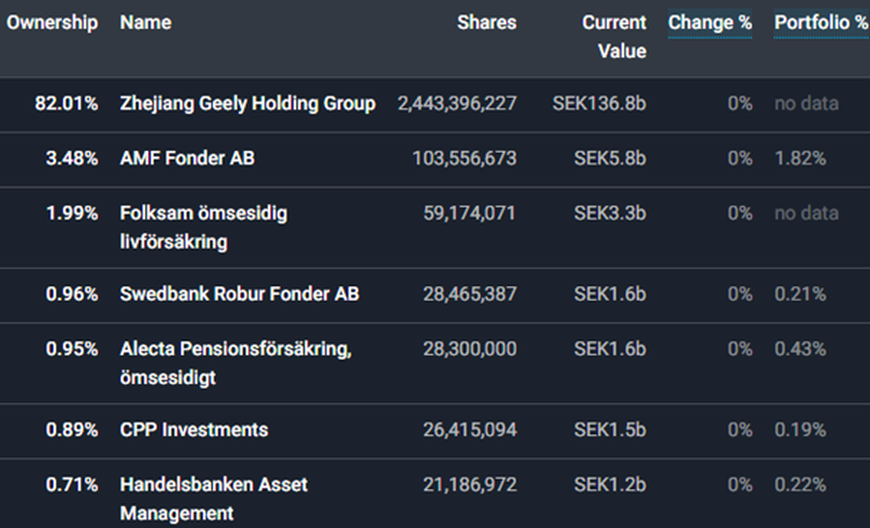
Business
MTN is a pan-African leading mobile telecommunication operator with the strategic intent of ‘Leading digital solutions for Africa’s progress’. Inspired by their belief that everyone deserves the benefits of a modern connected life, they provide a diverse range of
- voice,
- data,
- fintech,
- digital, enterprise,
- wholesale, and
- API services to more than 272 million customers in 19 markets.
Brands
Below an image showing some of MTN's Group main brands and investments. South Africans are sure to recognize several the brands in the image below.
Key Data
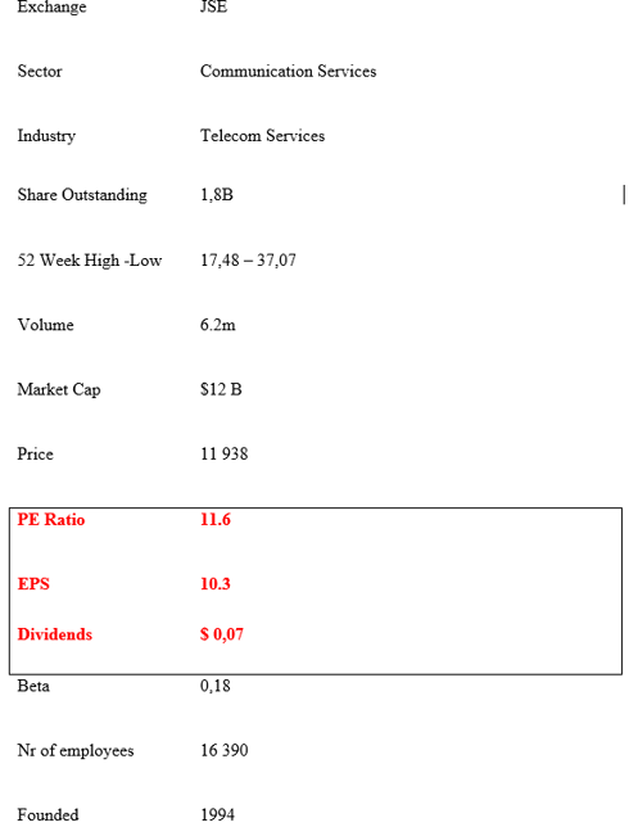
MTN Income Statements
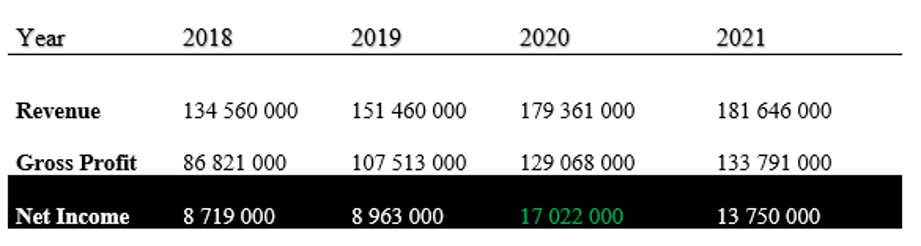
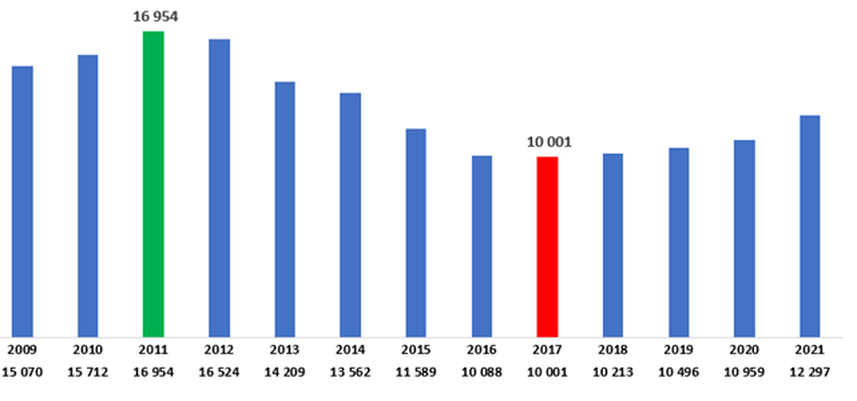
Sales per business - break down MTN revenue sources
MTN Group sales per business break down by activity as follows: mobile telecommunication is the biggest revenue contributor 73,5% as 2021, following by digital & fintech and interconnect and roaming, while sale of cell phones and accessories contribute 5,4%.
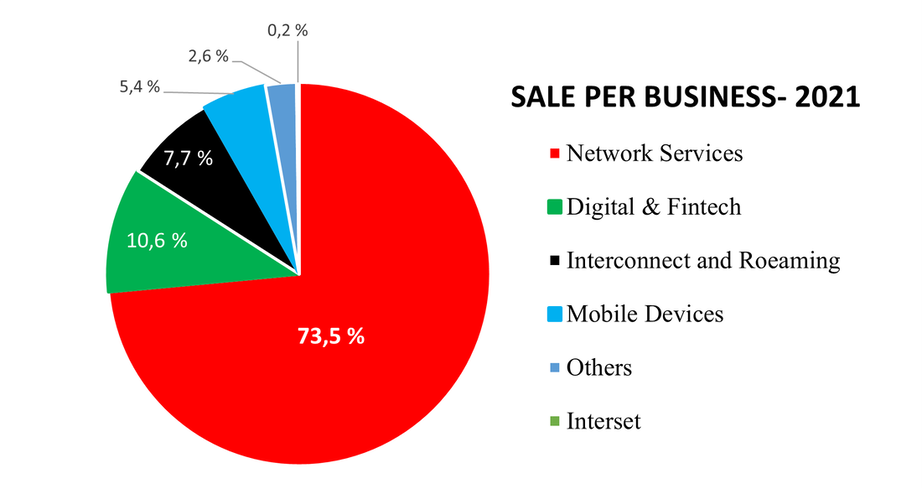
MTN - Price fluctuations
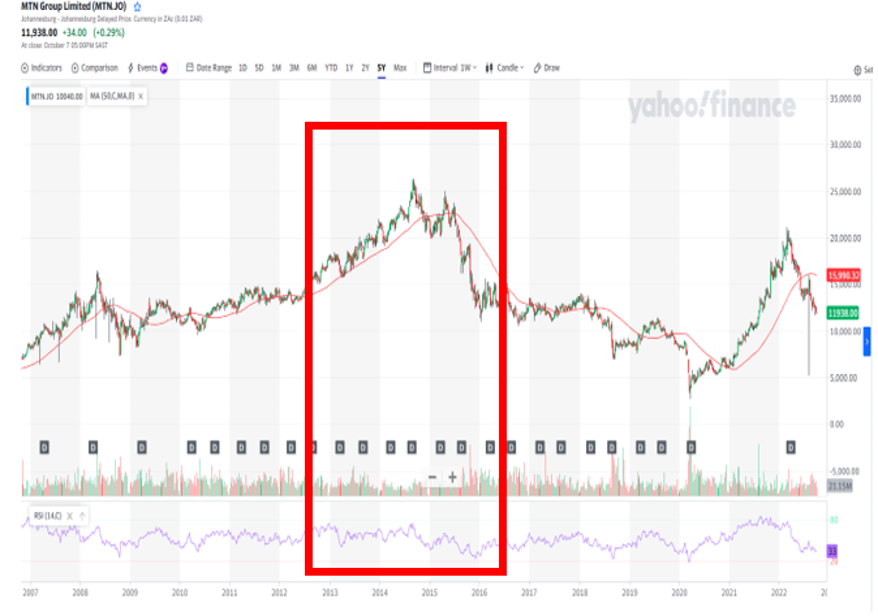
5 years price summary
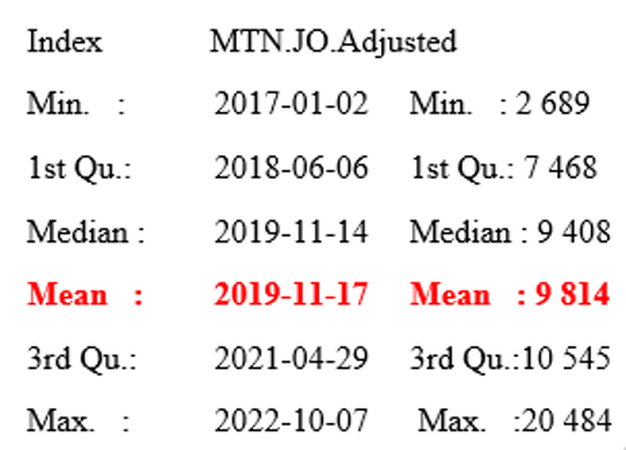
1000 trading days - MTN price distribtion
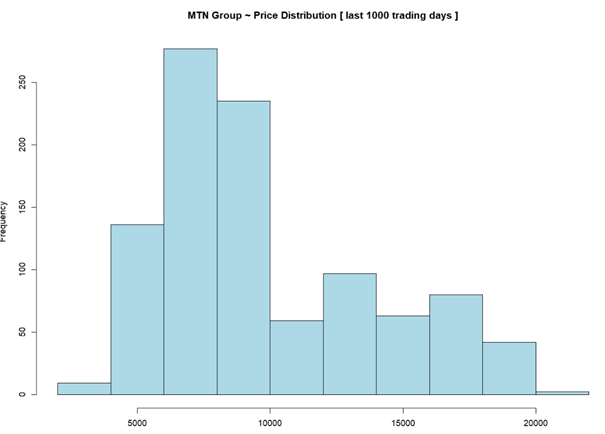
Monthly MTN stock
price fluctuations
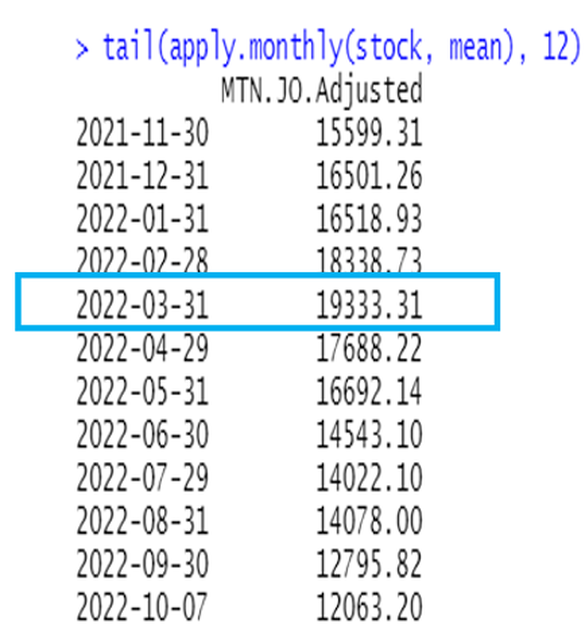
Last 15 Months
MTN stock Returns
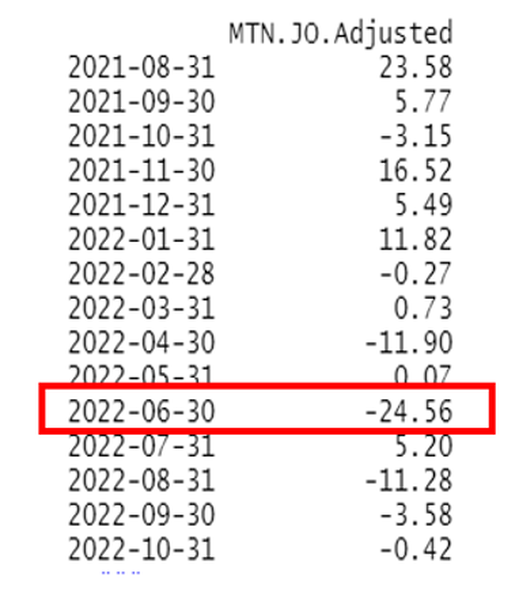
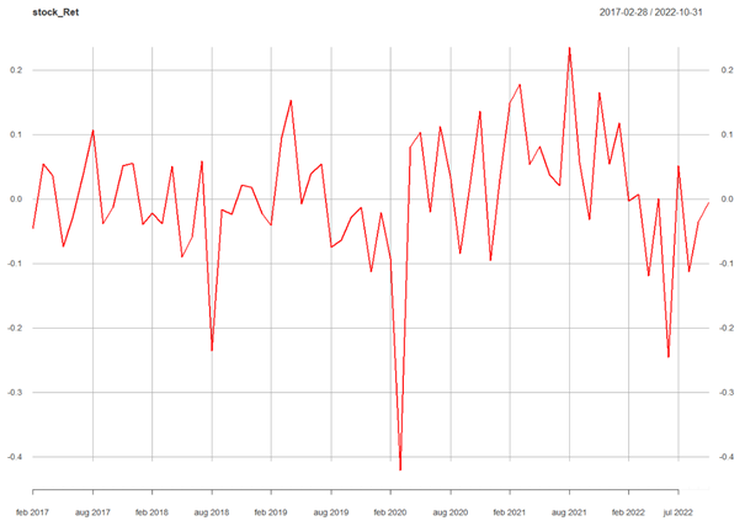
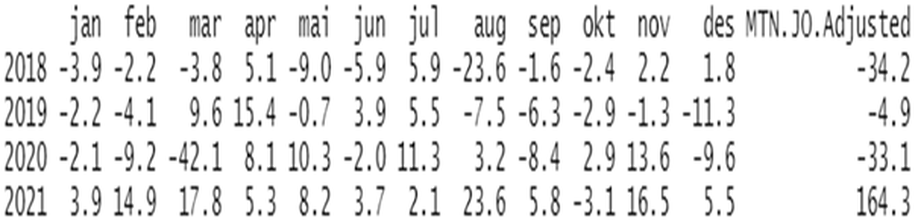
Median Price,
RSI & ROC
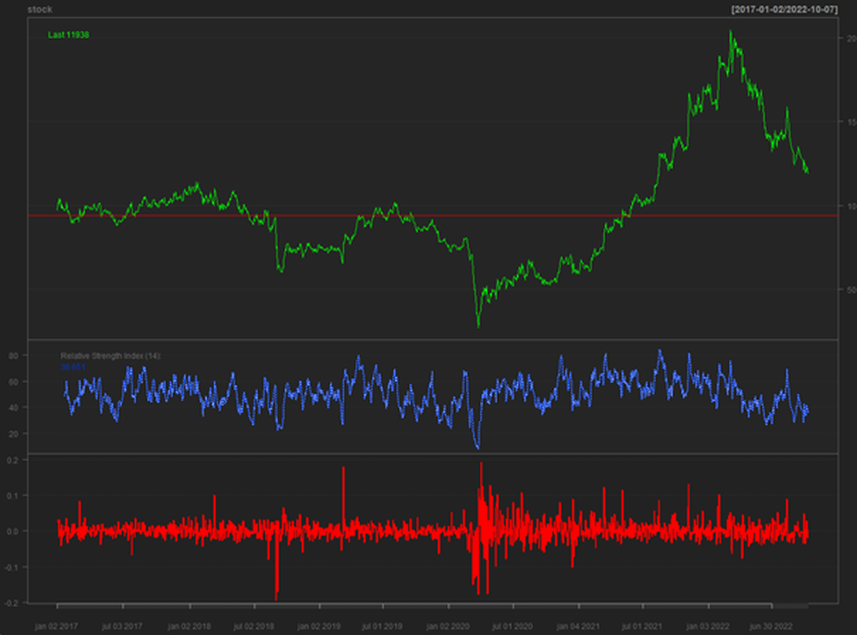
Yearly MTN
stock price
fluctuations
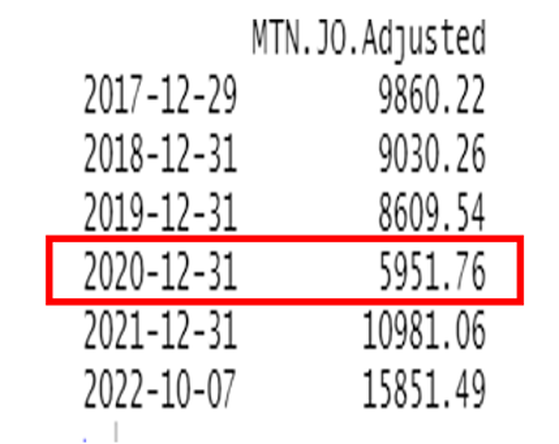
Valuation
PE Ratio vs competitors: MTN is good value based on its Price-To-Earnings Ratio (11.0x) compared to the peer average (18.5x). Industrial average PE ratio is currently at 14.5x, MTN PE ratio is well below industrial and its competitors. We can conclude that base of historical data MTN is slightly undervalued compared to its fair value.
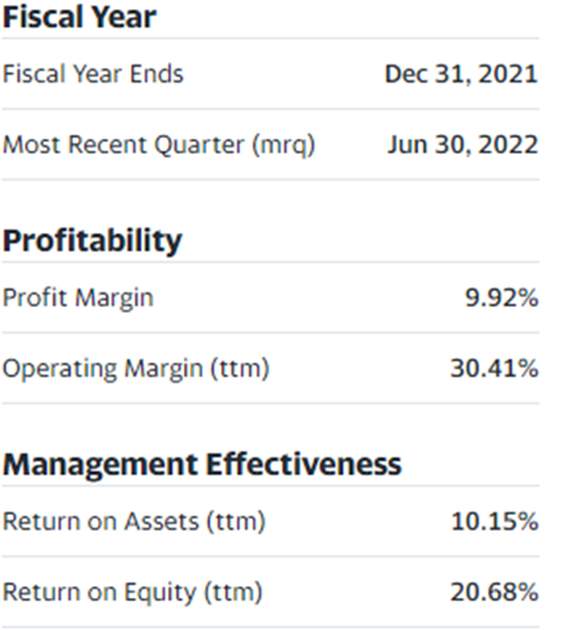
Opportunities
There is a structurally higher demand for data services and accelerating transaction values in fintech businesses. To support this, MTN Group is investing in the coverage, capacity and resilience of their networks, as well as the scaling of their platforms. They are increasing investment in the networks to R34.4 billion. MTN expect capex intensity to decelerate as the business grows, with Group capex intensity anticipated to reduce in the range of 18% to 15%. They have enhanced their medium-term guidance, raising our targets for Group service revenue growth and returns, in turn creating shared value.
781m (72%) people in SSA still not connected to mobile internet SSA mobile internet users to grow to 474m by 2025 from 303m in 2020 ~46% of Africa’s population is unbanked 95% of payments remain cash based with 90% of economies driven by small business.
781m (72%) people in SSA still not connected to mobile internet SSA mobile internet users to grow to 474m by 2025 from 303m in 2020 ~46% of Africa’s population is unbanked 95% of payments remain cash based with 90% of economies driven by small business.
Segments - Group
At least mid-teens growth
- South Africa: mid-single-digit growth
- Nigeria: at least 20% growth Accelerate fintech platform growth
- >20% service revenue contribution Holdco leverage
- ≤ 1.5x, faster non-ZAR deleveraging Asset realisation
- >R25 billion Adjusted RoE
- Improvement towards 25
Revenue VS PE Ratio
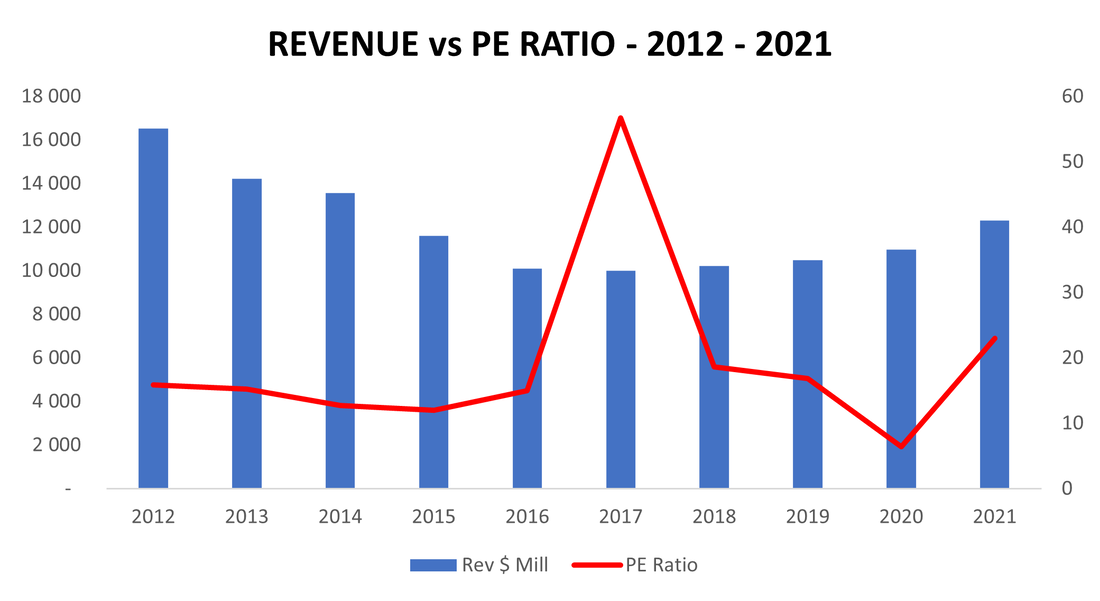
MTN GROUP
FINANCIAL HEALTH
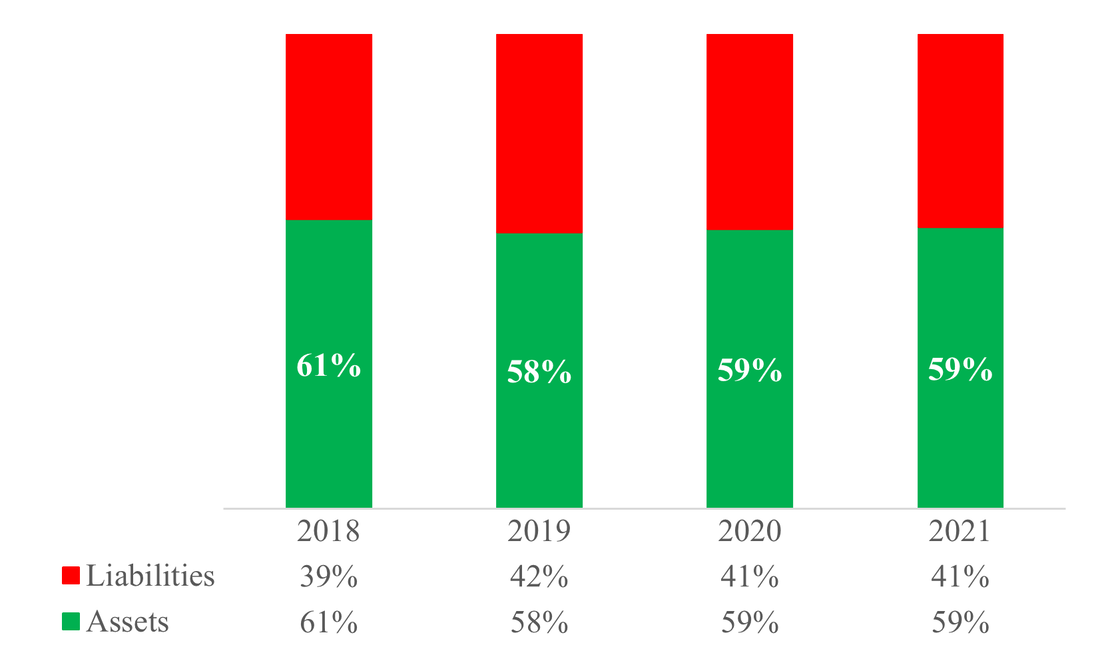
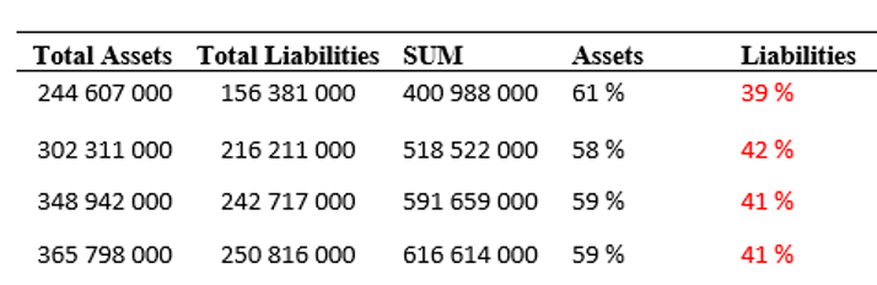
Management
Ralph Mupita(50Y)
5.5 years tenure è average management tenure is only 2.1 years
R51, 310, 000 salary
Mr. Ralph Tendai Mupita, BSc (Hons)(Eng.), MBA, GMP (Harvard), serves as Non-Executive Director of MTN Nigeria Communications PLC since April 13, 2017. He served as a Non-Executive Director at Scancom Plc since June 1, 2018 until May 25, 2021. He served as an Independent Non-Executive Director of Rand Merchant Investment Holdings Limited since March 31, 2018 until November 24, 2021.
He was Group Chief Financial Officer at Mobile Telephone Networks Holdings Limited until August 31, 2020 and has been its Executive Director since April 3, 2017. He is Group President and Chief Executive Officer of Mobile Telephone Networks Holdings Limited since September 01, 2020. Mr. Mupita had been Group Chief Financial Officer of MTN Group Limited since April 3, 2017 until August 31, 2020. He has been Executive Director of MTN Group Limited since April 3, 2017 and serves as its Group President and Chief Executive Officer since September 01, 2020.
He served as the Director of Special Growth Projects for Old Mutual Life Assurance Company (South Africa) Limited. He joined Old Mutual in 2000, he was seconded to Old Mutual Zimbabwe where he worked on a strategy project that led to re-structuring several functional areas within Old Mutual Properties (Zimbabwe). On re-joining Old Mutual South Africa in July 2001, Mr. Mupita looked after the strategy & business planning functions for Individual Life as a Strategy Director. He has extensive experience in the financial services sector, having had a distinguished career at Old Mutual over.
He worked on engineering and construction projects in SA. A key responsibility in this role was the Vision 2002 Programme. From October 2002 to October 2003, he became responsible for customer development for the retail middle market business (Personal Finance). From October 2003 to October 2004, he was responsible for Group Direct Sales (Old Mutual's direct marketing & sales business unit) as well as retail Customer Management.
He served as Managing Director of Old Mutual Unit Trusts since October 1, 2004. He served as a Non- Executive Director of UAP Holdings Limited since June 19, 2015 until January 31, 2017. He served as a Director of Kotak Mahindra Old Mutual Life Insurance Ltd. from May 1, 2011 to March 27, 2013.
Mr. Mupita holds B. Sc. Engineering (Hons), with construction projects in South Africa and completed his MBA at the University of Cape Town in 2000. He is a graduate of Harvard Business School's GMP programme and has also attended executive programmes at London Business School and INSEAD.
Ownership Structure
Top Institutional Holders
 RSS Feed