 BussinessNaspers is a global consumer internet group and one of the largest technology investors in the world. Naspers Limited operates in consumer internet industry worldwide. The company builds various companies that empower people and enrich communities. It holds investments in classifieds,
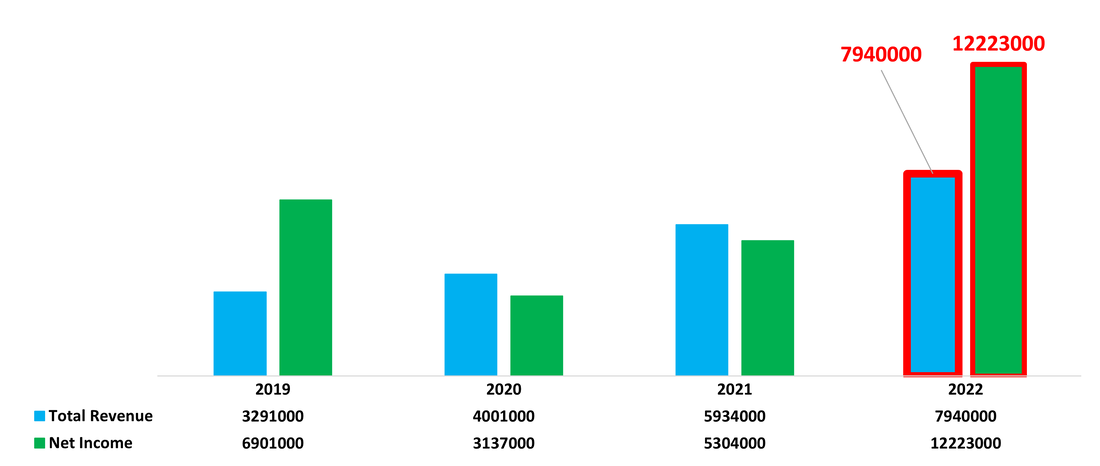
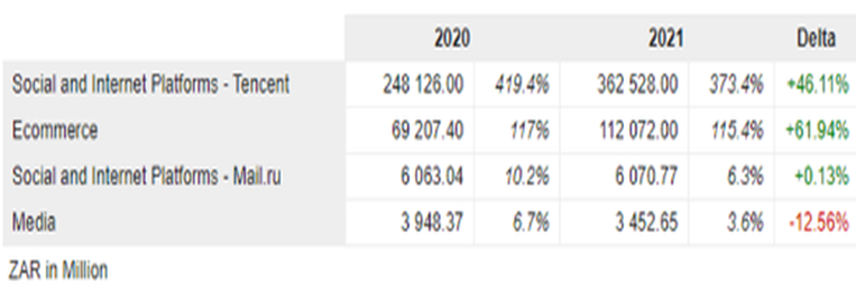
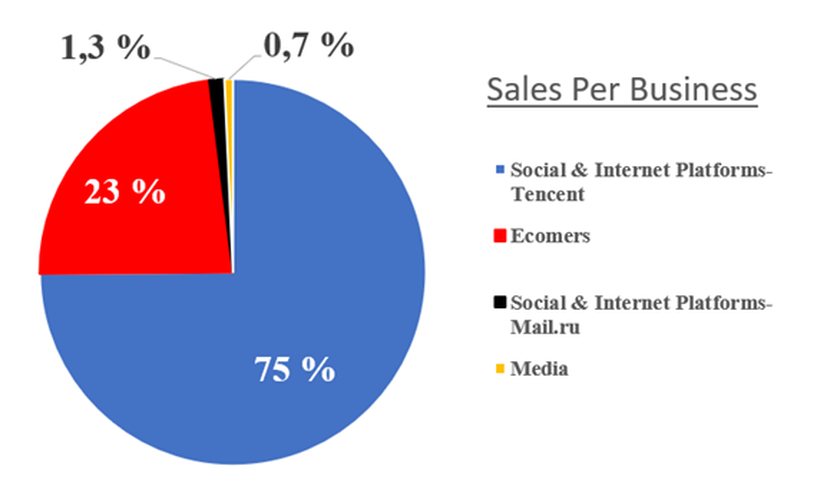
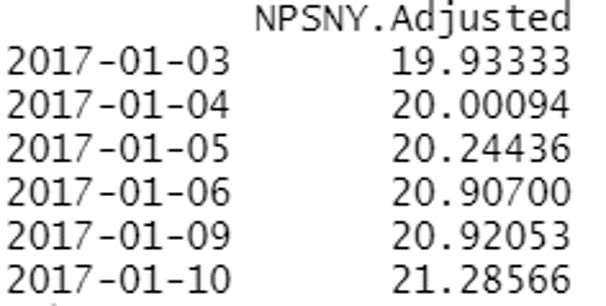
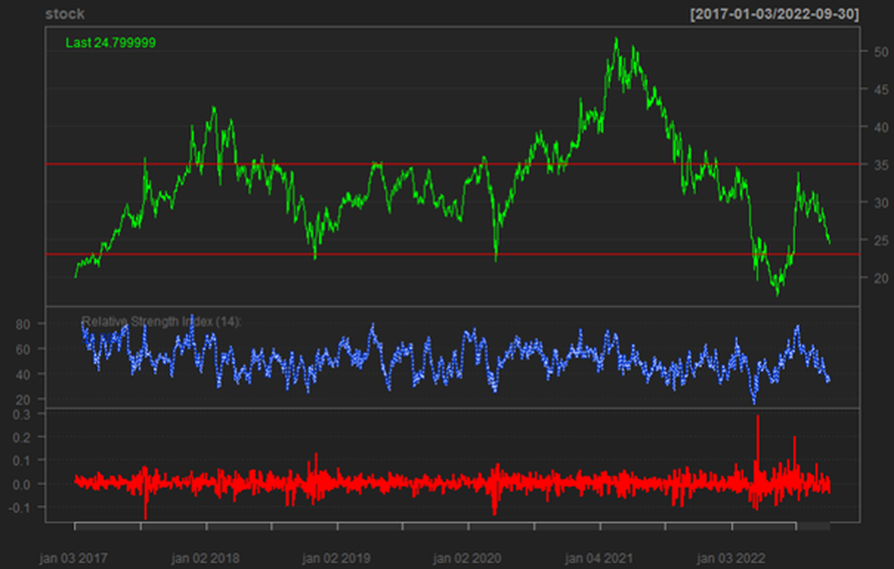
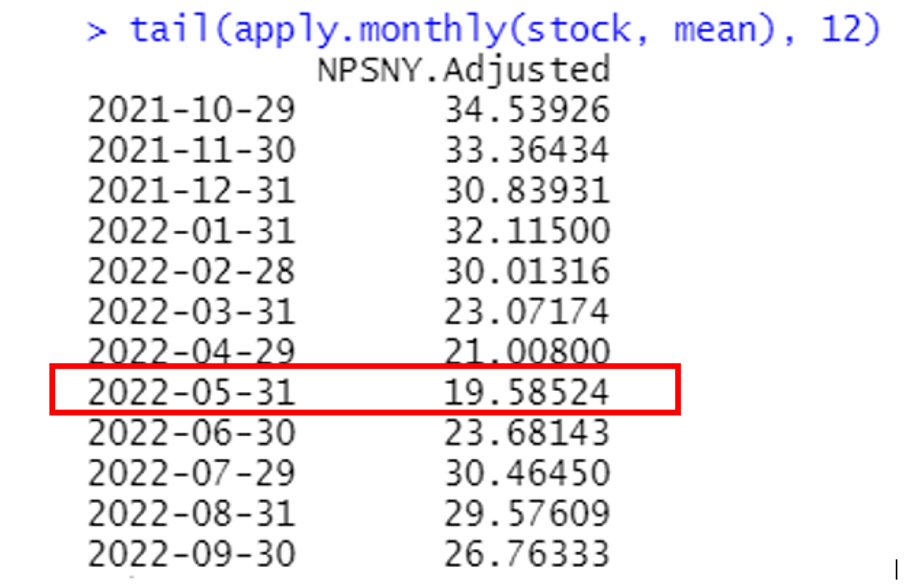
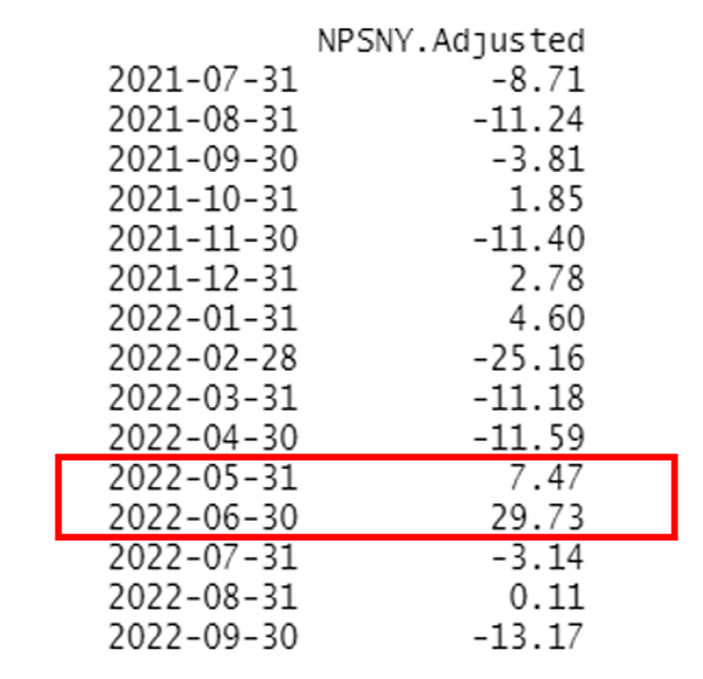
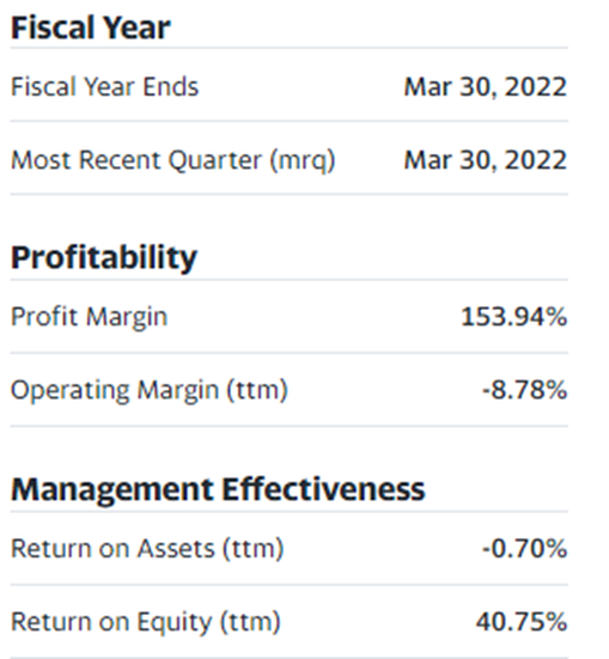
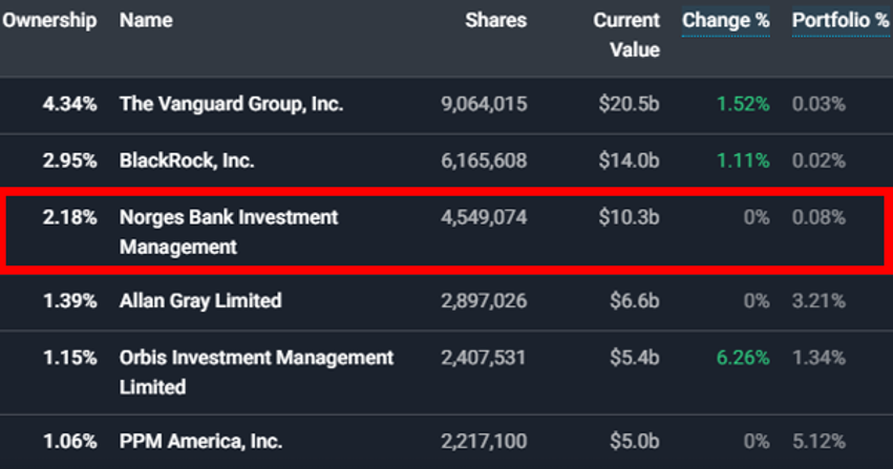
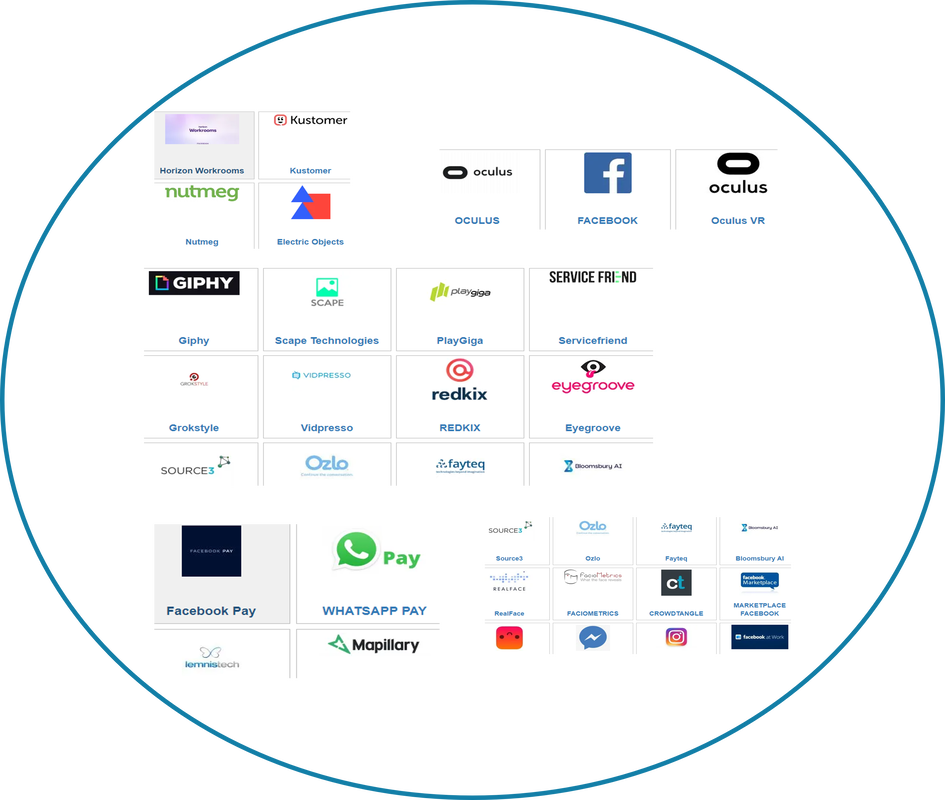
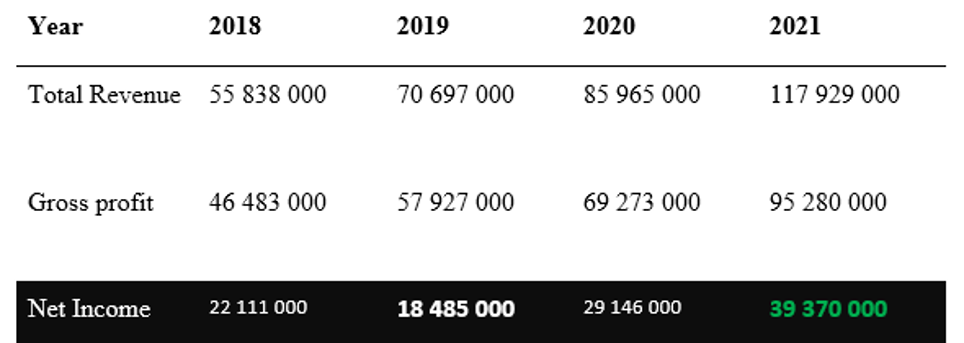
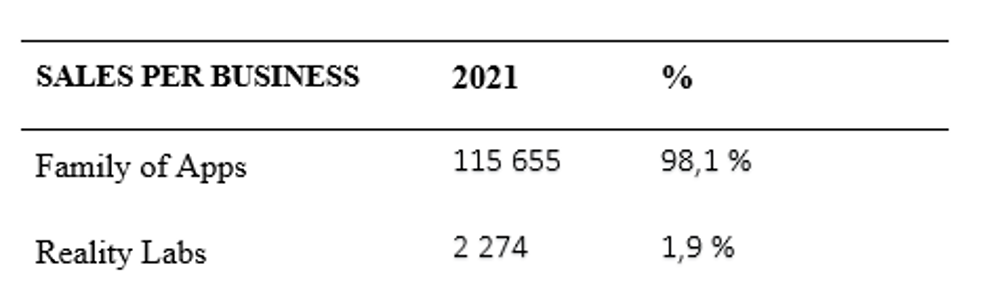
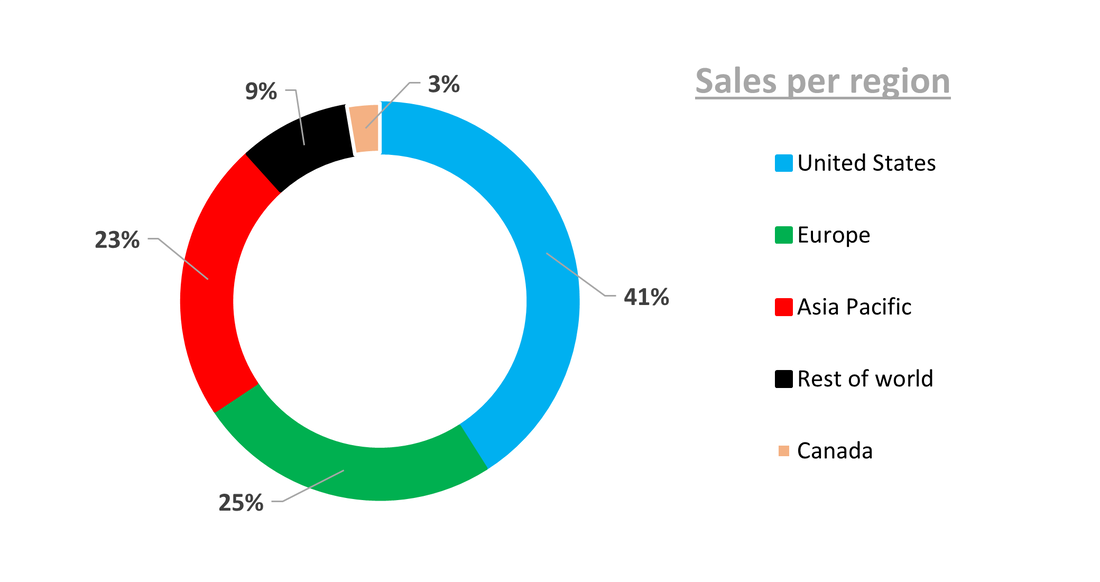
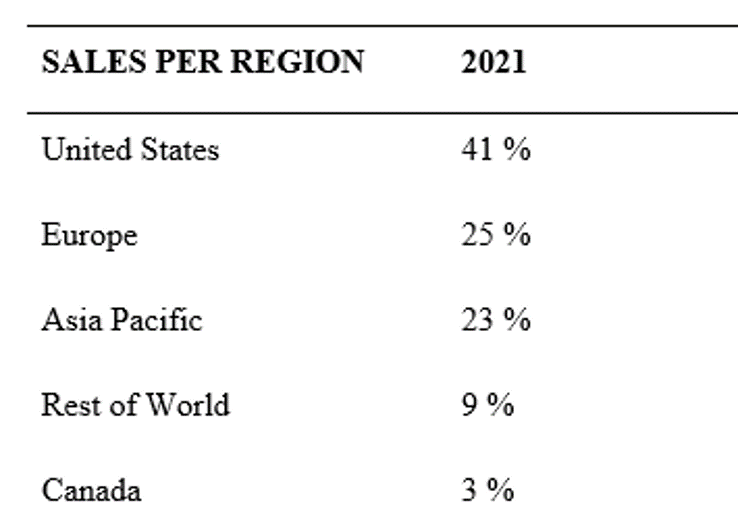
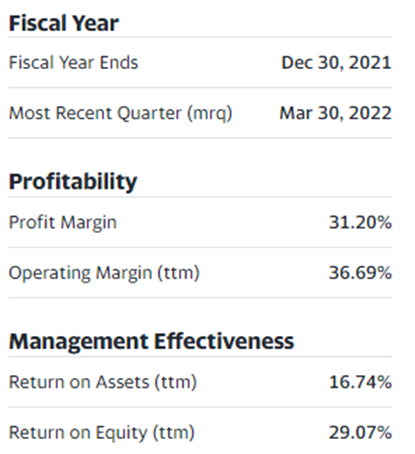
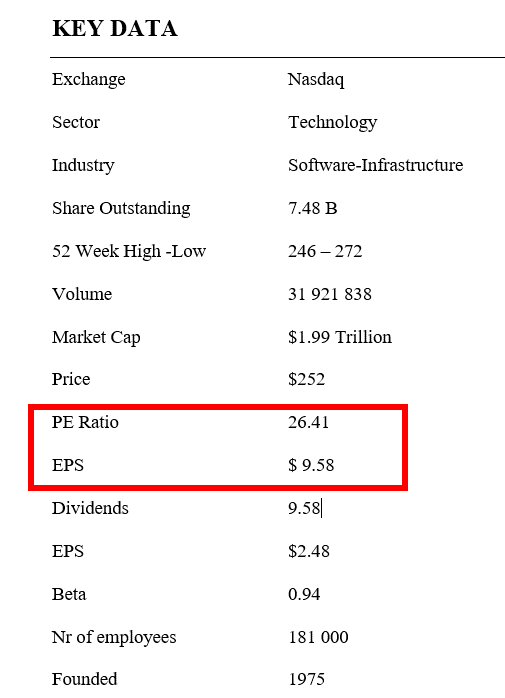
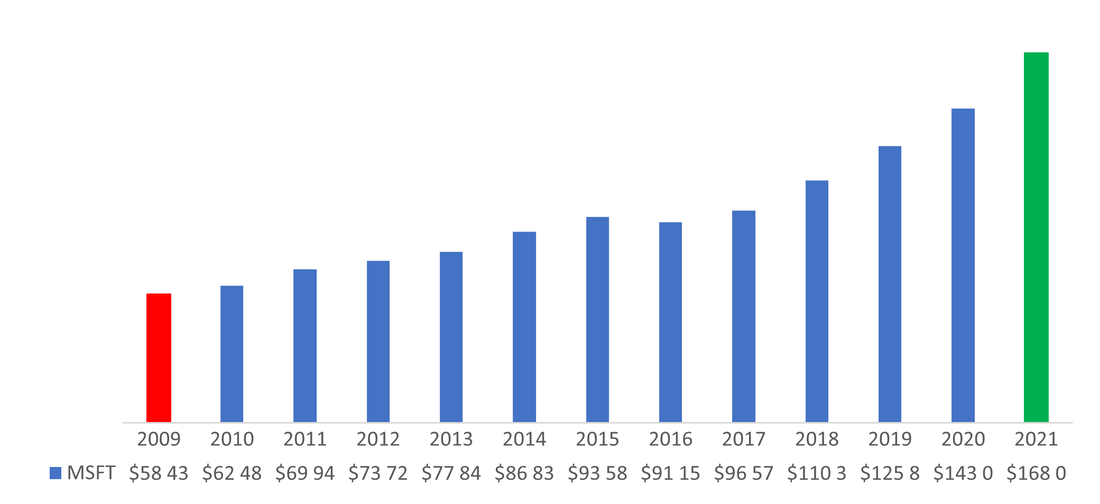
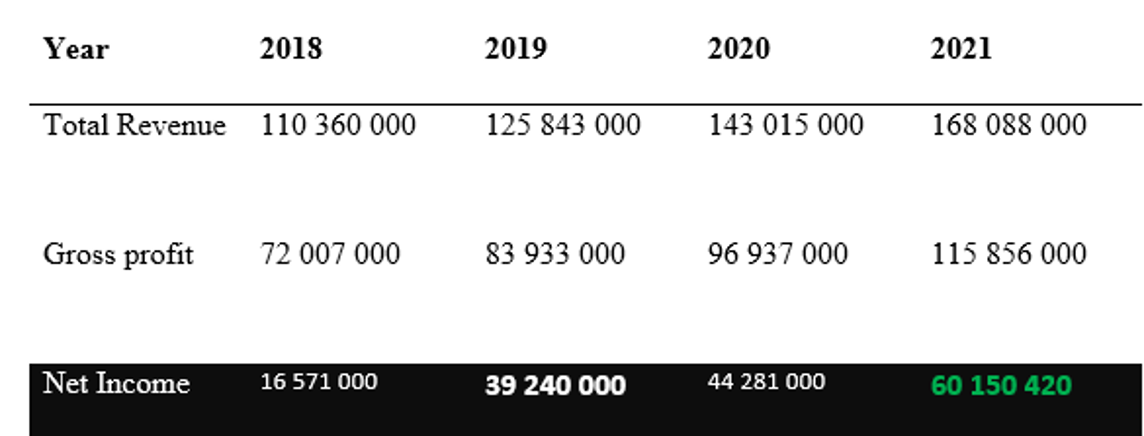
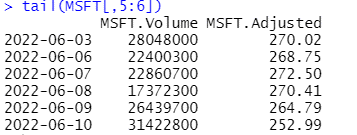
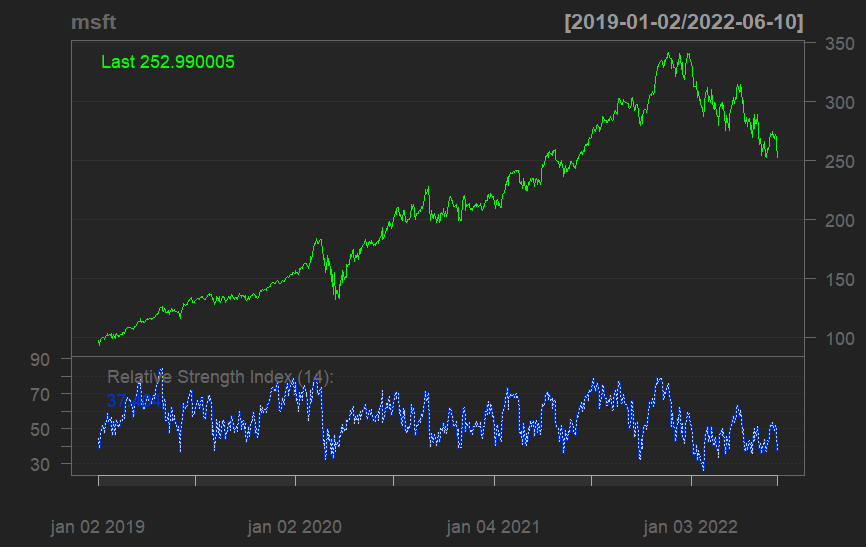
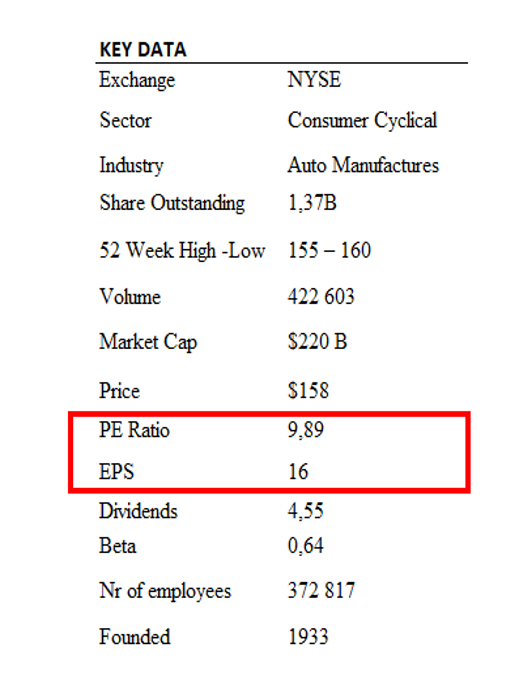
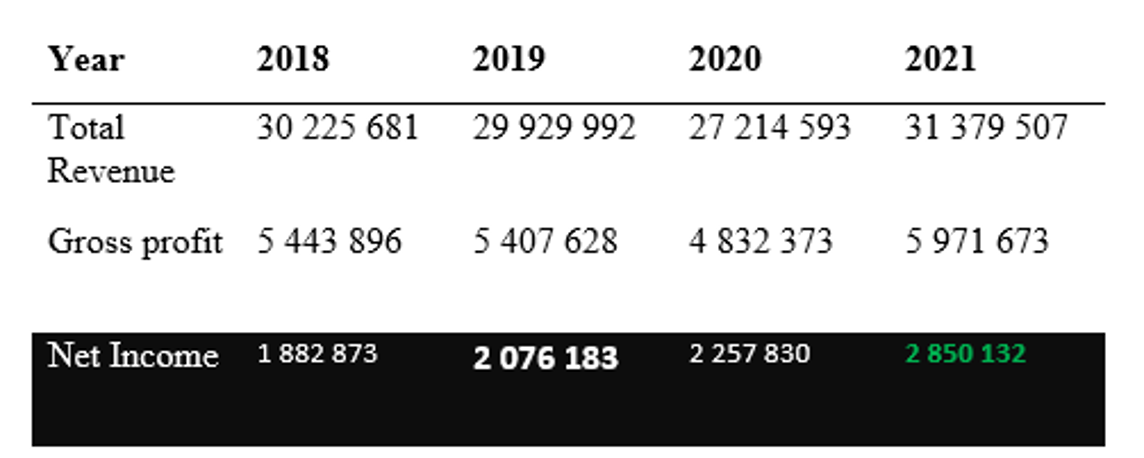
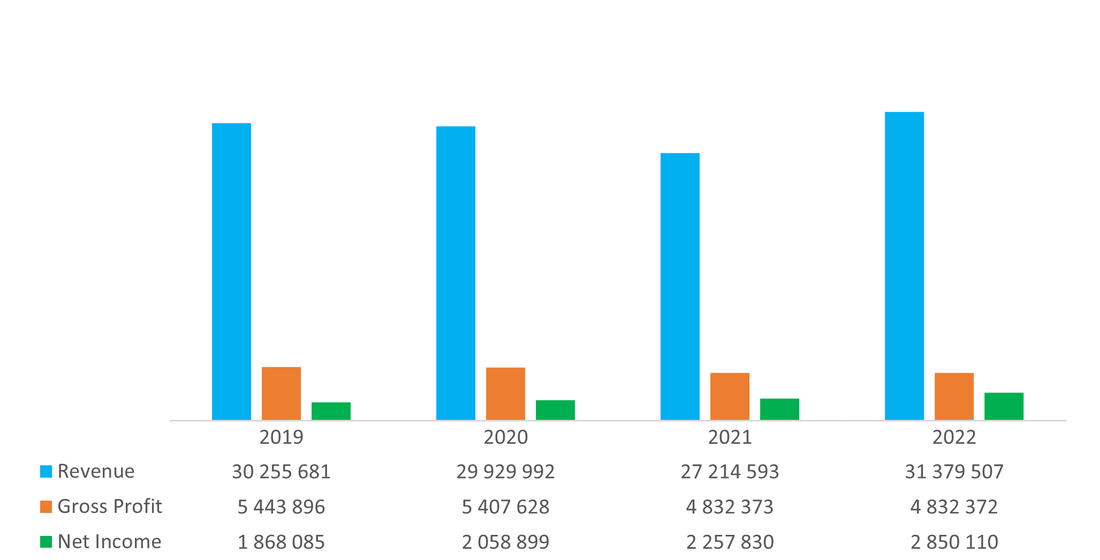
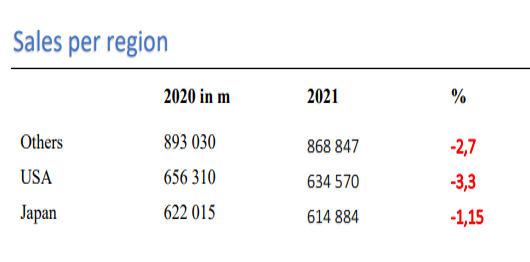
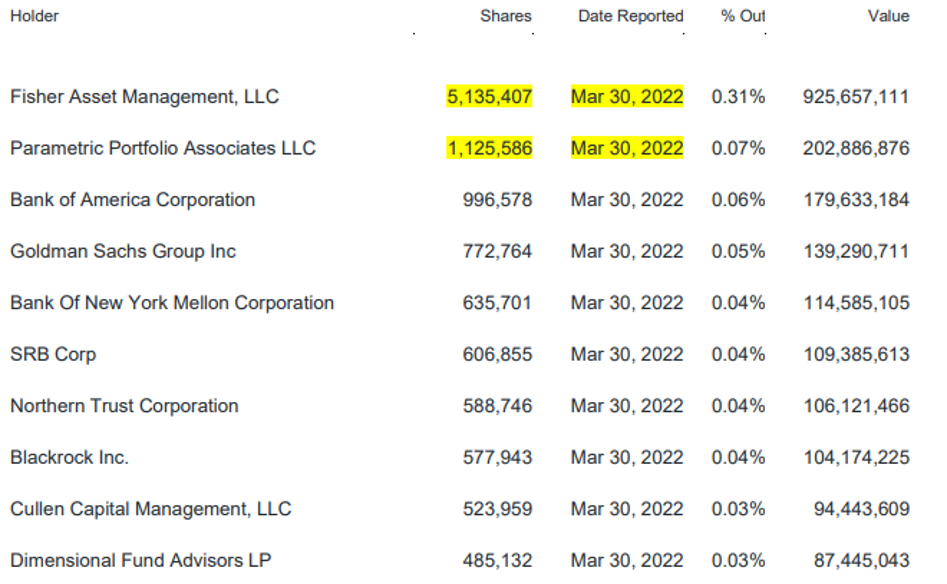
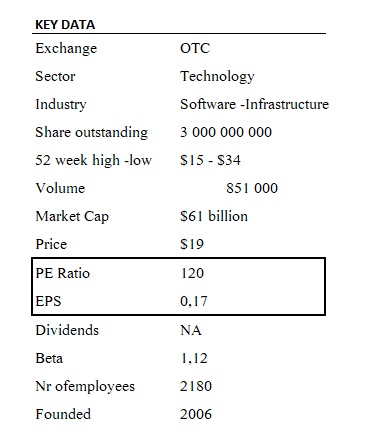
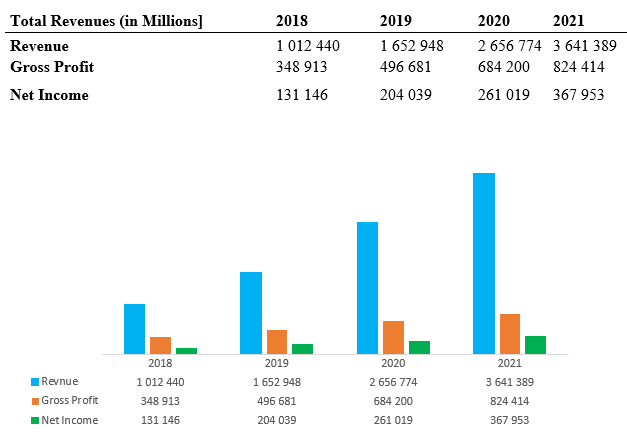
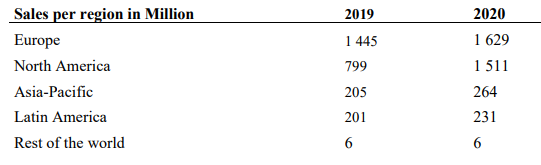
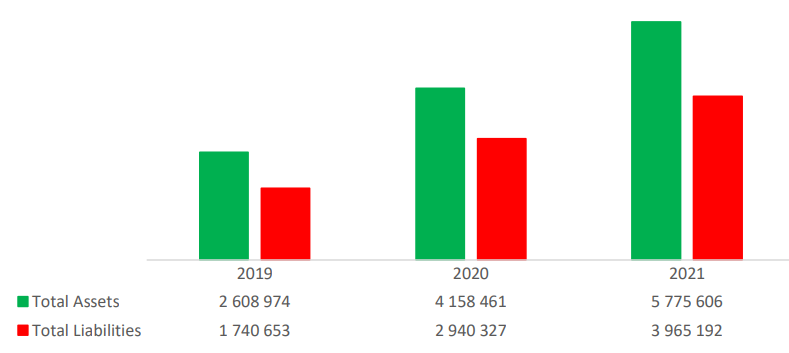
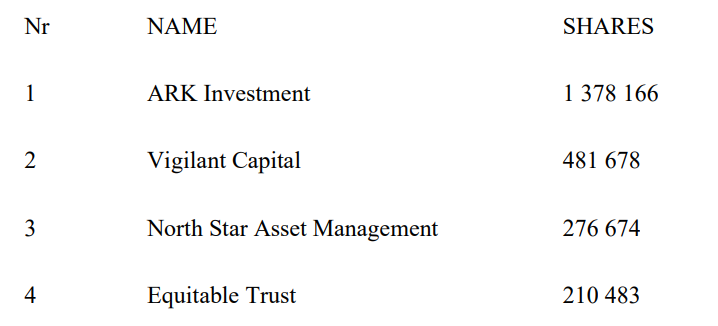
Through Prosus the group invests and operates globally in markets with long-term growth potential, building leading consumer internet companies that empower people and enrich communities. Prosus has its primary listing on Euronext Amsterdam and a secondary listing on the JSE Limited’s stock exchange. It also has an American Depository Receipts (ADR) programmed trading on an over-the-counter basis in the United States. Naspers is the majority owner of Prosus. They are committed to investing in entrepreneurs and in technologies that improve people’s lives. From India to Brazil to South Africa to Russia – well over a billion people around the world benefit from Naspers-backed businesses. Billions more are within our reach and we’re keen to help them too. They continue to grow and address big societal needs and, in turn, create greater value over time. They operate or partner with several leading internet businesses across Africa, Central and Eastern Europe, the Americas and Asia in sectors that include online classifieds, food delivery, payments and fintech, etail, social and internet platforms, education, and health. BrandsBelow an image showing some of Naspers's main brands and investments. South Africans are sure to recognize several the brands in the image below.  Key Data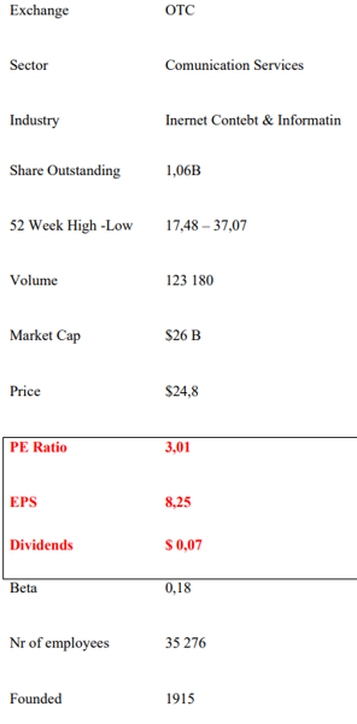 The following tables |


 RSS Feed
Service Disclosure:
Tela operates as an independent equity research and analysis firm. Services from Tela are available solely upon the formalization of a service agreement between the client and Tela. The content presented on this website serves purely for informational purposes. Any guidance or advice offered should be considered as general advice, not taking into account your personal financial circumstances, goals, or needs.
It is important to understand that historical investment performance is not indicative of future results. The returns on investments can be affected by multiple factors such as political dynamics, consumer behavior, market trends, inflation, unforeseen natural disasters, liquidity, market sentiment, and a variety of other risks.